Gold is trading under downward pressure around $3,965, after hitting a new monthly low—for now—and falling below the 21-day simple moving average (SMA) and the -1/8 Murray line. We also
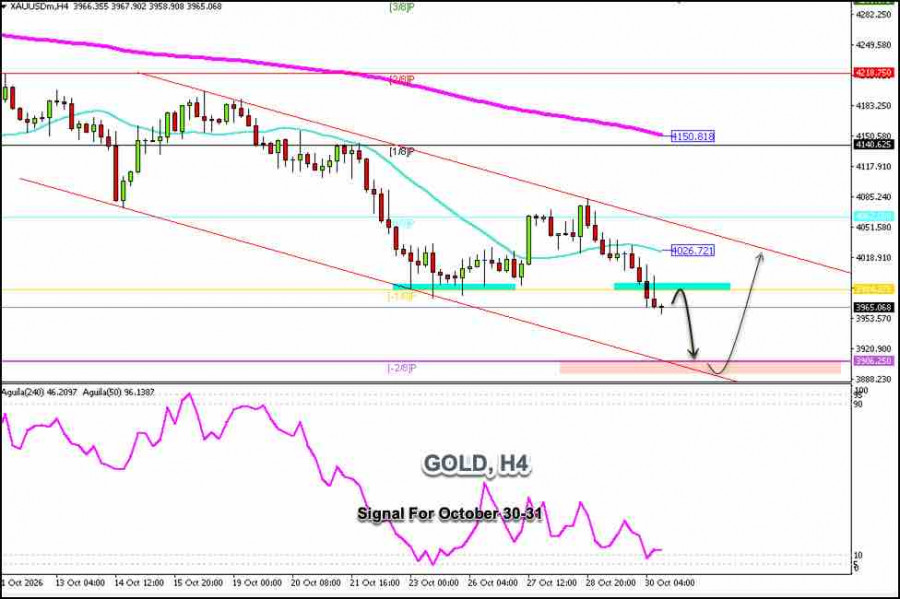
Gold is trading under downward pressure around $3,965, after hitting a new monthly low—for now—and falling below the 21-day simple moving average (SMA) and the -1/8 Murray line. We also note that it has reached the daily S_2 level and may be approaching a solid support level, so we should keep a close eye on this area.
Gold could continue its fall—having already broken below the $3,984 low that had formed as a consolidation since October 23—so we must remain vigilant.
During the European session, XAU/USD reached the psychological level of $4,000; however, it failed to consolidate above this zone, and another technical correction occurred as part of the continuation of the downtrend. If the price continues to fall below $3,984, the outlook could remain negative, and we could expect it to reach the Murray -2/8 level, around $3,906.
If the downward momentum prevails, we could see the price reach the Murray -2/8 level, around $3,906. Given that gold has been sending negative signals since it reached the upper band of the downtrend channel, around $4,080, it is likely approaching key support levels such as $3,950 and $3,906—both levels warrant close monitoring, as a break below them could lead to further declines.
The Eagle indicator has reached oversold levels. From a technical standpoint, we could be facing a technical rebound, but we should wait for a consolidation pattern to form. For now, we don't see any signs of that, as we are currently heading toward a key support level that could set the stage for a technical rebound.
Our trading plan for the next few hours is to monitor the $3,950 area; if the price falls below this level, it will be interpreted as a sell signal. On the other hand, the $3,906 area could be a good point to open long positions, but with caution—it's better to wait for consolidation and for the price to show strong support.

QUICK LINKS









 Contact Us