On Wednesday, December 31, the EUR/USD currency pair continued a weak downward movement with total volatility of 39 pips. Many analysts feared that during the New Year and Christmas holidays, the market could deliver strong moves due to its own "thinness." However, those fears were unfounded. Traders behaved as holidays dictate — that is, practically not at all. Over the last five trading days, the average volatility is 37 pips, which aptly reflects the holiday status of these days.
Although the holidays are over, we consider Friday a holiday as well. Think about it: this week had three working days immediately after Christmas, then New Year's Day, then a day off, then Friday, and two more days off. Why should the market force events on a Friday that is frankly torn out of the general flow if it can wait until Monday? With the new week, macroeconomic data and the fundamental backdrop will return to the market. Therefore, we do not expect any sharp or strong moves today.
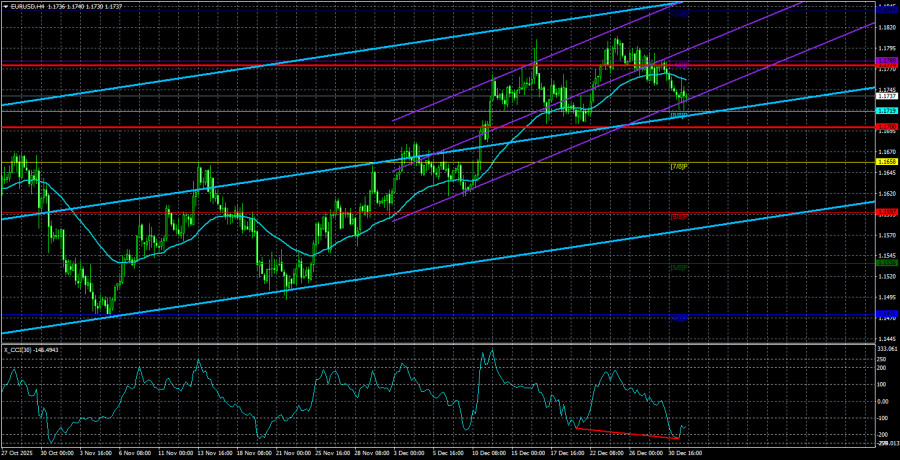
We must note several important technical factors. Lately, we have regularly stated that the uptrend remains intact in the medium term. It also persists on the 4-hour timeframe, despite the close below the moving average. But pay attention to the CCI indicator. It has once again formed a "bullish" divergence, which, on an uptrend, means nothing other than a warning about the resumption of the trend. Of course, the correction could be stronger than it is now, but even then, one should expect at least a slight upward price rebound.
On Monday, the U.S. will begin publishing important data on the labor market, unemployment, and ISM business activity. We do not want to heap ashes on the dollar's head in advance, but who now believes these reports will show strong figures? Of course, dollar growth could be supported by weak figures that come in above forecasts. However, in any case, everyone on the market understands that the U.S. labor market remains in a stupor, so the dollar is unlikely to receive support from these reports.
In this case, a technical signal for a new dollar decline may coincide with the macroeconomic backdrop. As before, we expect only a rise in EUR/USD and the end of the six-month flat in the 1.1400–1.1830 range.
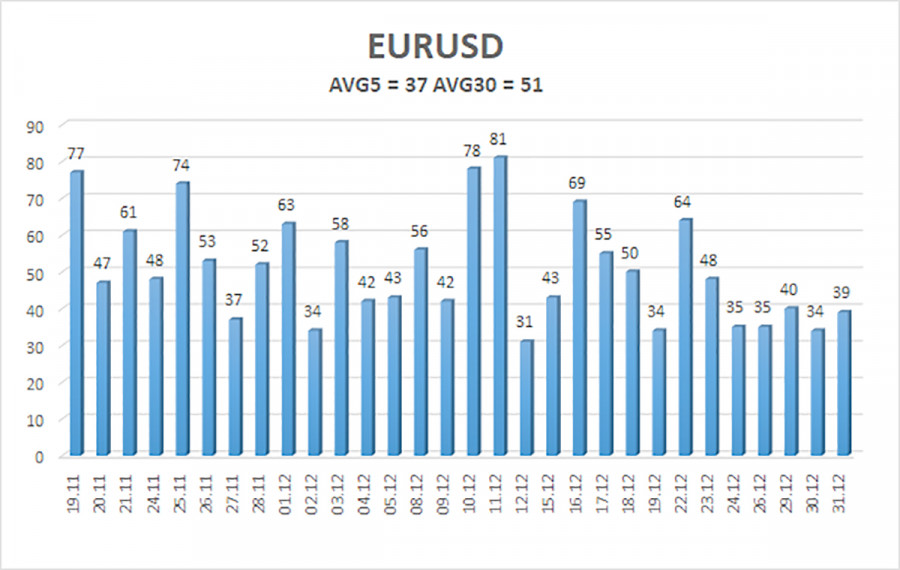
The average volatility of the EUR/USD pair over the last five trading days as of January 1 is 37 pips, which is considered "low." We expect the pair to trade between 1.1700 and 1.1774 on Friday. The higher linear regression channel is turning upward, but the flat on the daily timeframe persists. The CCI entered the oversold area twice in October (!!!), but in early December, it visited the overbought area. We have already seen a slight pullback.
S1 – 1.1719
S2 – 1.1658
S3 – 1.1597
R1 – 1.1780
R2 – 1.1841
The EUR/USD pair has closed below the moving average, but an uptrend remains on all higher timeframes, while the daily timeframe has been flat for the sixth month in a row. The global fundamental backdrop remains highly significant for the market and negative for the dollar. Over the past six months, the dollar has occasionally shown weak gains, but exclusively within a sideways channel. It has no fundamental basis for long-term strengthening. With the price below the moving average, one can consider small short positions on purely technical grounds with targets at 1.1700 and 1.1658. Above the moving average, long positions remain relevant with a target of 1.1830 (the upper line of the flat on the daily timeframe), which has already effectively been worked out. Now the flat needs to end.

QUICK LINKS


 Contact Us

