The EUR/USD currency pair traded with minimal volatility on Wednesday, as expected, given it was December 31. It is difficult to even guess who opened trades on December 31, especially in the second half of the day, so the whole day takes on a rather formal, thoroughly holiday feel. Nevertheless, it should be noted that EUR/USD closed on the hourly timeframe below the ascending trendline and below the Ichimoku indicator lines. We believe holiday moves should not be treated too seriously. Today, the price may already close above the Kijun-sen and Senkou Span B lines, indicating the resumption of the uptrend. The macroeconomic and fundamental backdrop was absent, and news will begin to arrive for traders on Monday, January 5.
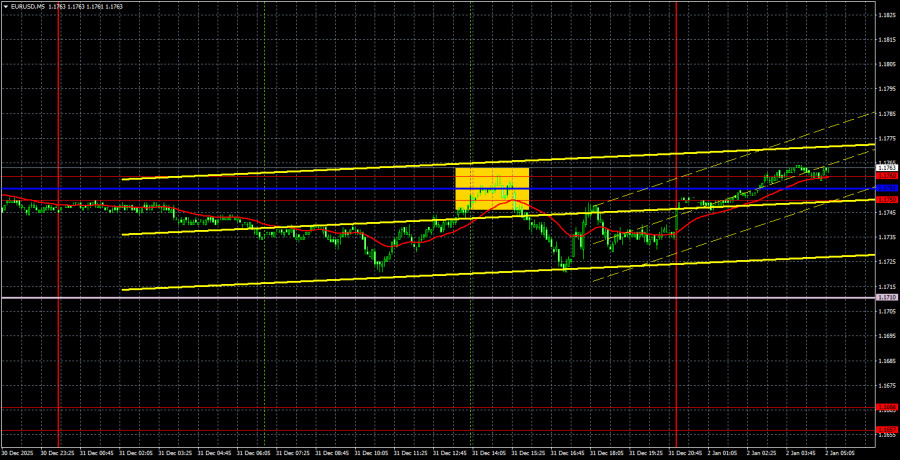
On the 5-minute timeframe on Friday, one sell trade signal was formed. During the US session, a few hours before market close, the price rebounded from below from the 1.1750–1.1760 area and the Kijun-sen line. After that, the pair moved about 20 pips in the desired direction, which could have been earned if someone opened positions a few hours before the New Year.
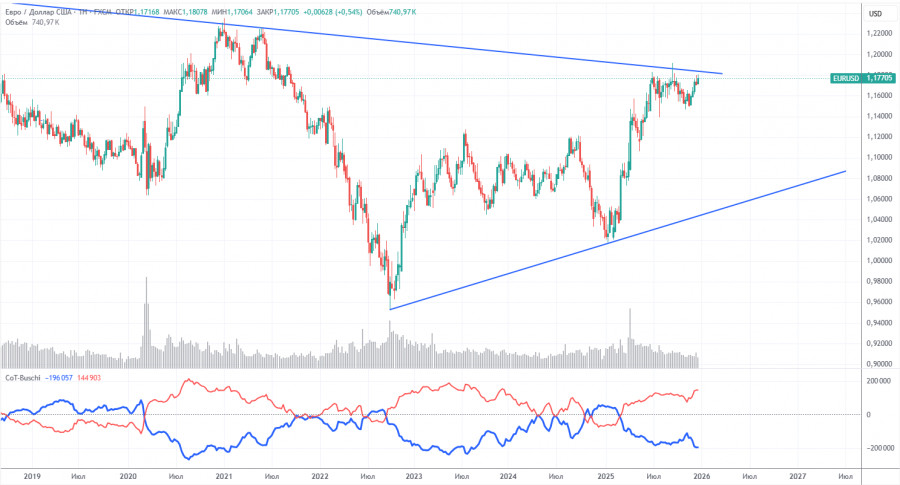
The latest COT report is dated December 16. The illustration above clearly shows that the net position of non?commercial traders was bullish for a long time; bears barely moved into dominance at the end of 2024 but very quickly lost it. Since Trump took office for a second time as US president, only the dollar has been falling. We cannot say that the decline of the US currency will continue with 100% probability, but current world developments point to that scenario. The red and blue lines are diverging, indicating the bulls' strong dominance.
We still do not see any fundamental factors for the strengthening of the euro, while there are plenty of factors for the decline of the US currency. The global downtrend still persists, but what does it matter where the price moved over the past 17 years? Over the last three years, only the European currency has been rising, and that is also a trend.
The placement of the red and blue indicator lines continues to indicate the preservation and strengthening of the bullish tendency. During the last reporting week, the number of longs among the Non?commercial group increased by 8,900, and the number of shorts by 2,700. Accordingly, the net position for the week grew by 6,200 contracts.
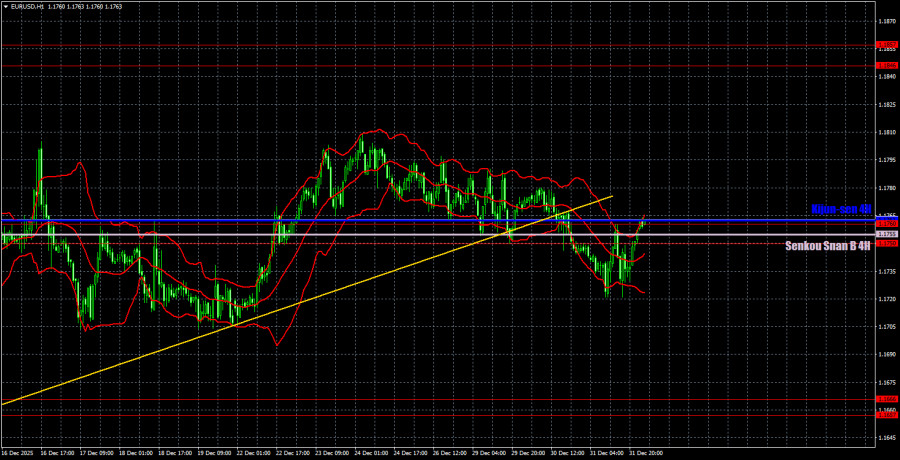
On the hourly timeframe, EUR/USD remains in an upward trend. The upper line of the sideways channel 1.1400–1.1830 was tested twice, so in the near term, we may observe a technical decline, as the daily timeframe flat remains. However, in the last days of the outgoing year we observed a downward correction, and in the new year bullish pressure may intensify. We expect euro growth to resume despite the breach of the trendline.
For January 2 we highlight the following trading levels — 1.1234, 1.1274, 1.1362, 1.1426, 1.1542, 1.1604–1.1615, 1.1657–1.1666, 1.1750–1.1760, 1.1846–1.1857, 1.1922, 1.1971–1.1988, as well as the Senkou Span B line (1.1755) and the Kijun-sen (1.1762). Ichimoku indicator lines may shift during the day, which should be taken into account when determining trading signals. Do not forget to move the Stop Loss to breakeven if the price has moved 15 pips in the correct direction. This will protect against possible losses if the signal turns out to be false.
No important events or releases are scheduled in the EU or the US for Friday. Movements may again be weak and non?trending during the day.
On Friday, traders can trade from the 1.1750–1.1760 area. A rebound in price from it would make short positions relevant, with a target zone of 1.1657–1.1666. A close above it would allow opening longs with a target of 1.1810–1.1830.

QUICK LINKS


 Contact Us

