The EUR/USD currency pair rose sharply at the market open on Monday, but then declined for the rest of the day, ending up at its starting level. Why did the dollar show such a weak decline, and why did the market react so tepidly to what seemed to be a significant event? In our view, the market is hesitant to draw conclusions. Yes, Donald Trump once again stated that an agreement with Iran has been reached, and this time Iran did not refute the words of the US president. However, the deal has not yet been signed, and the Strait of Hormuz remains blockaded. The signing ceremony is scheduled for Friday, and anything can happen before that. No later than yesterday, it became known that Israel is very unhappy with the agreement between Iran and the US and does not intend to cease its personal conflict with Lebanon. One of the conditions of the agreement between Iran and the US is a complete ceasefire in the region, including in Lebanon. Therefore, by Friday, Trump needs to solve another problem—convincing Israel to stop the war against Lebanon.
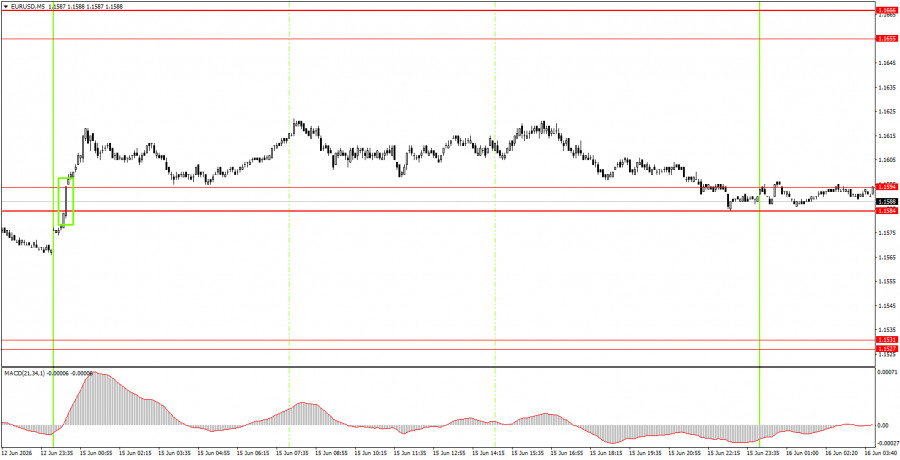
On the 5-minute timeframe on Monday, only one buy signal was formed. At the market's opening after the weekend, the price broke through the 1.1584-1.1594 area, but the upward movement was weak and short-lived. By the end of the day, the pair returned to the 1.1584-1.1594 area.
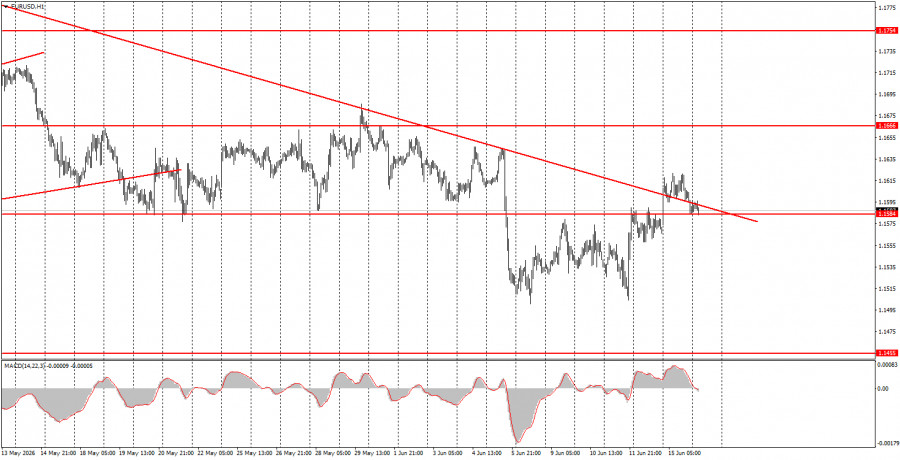
On the hourly timeframe, the flat has ended, and the downward trend has resumed after three weeks of stagnation, but further growth of the American currency will depend entirely on developments in geopolitical events. If a full-scale war resumes in the Middle East, the dollar will rise again. If Tehran and Washington sign the deal, demand for risk currencies will increase.
On Tuesday, novice traders may open short positions targeting 1.1527-1.1531 if the price settles below the 1.1584-1.1594 area. Long positions may be considered upon a rebound from the 1.1584-1.1594 area, with a target of 1.1655-1.1666.
On the 5-minute timeframe, the following levels should be considered: 1.1354-1.1363, 1.1413, 1.1455-1.1474, 1.1527-1.1531, 1.1584-1.1594, 1.1655-1.1666, 1.1745-1.1754, 1.1830-1.1837, 1.1899-1.1908. On Tuesday, the ZEW economic sentiment indices will be published in Germany and the European Union, while in the US, construction sector data will be released. We consider these reports secondary and do not expect a market reaction to them.
Price levels (areas) of support and resistance are targets when opening long or short positions or sources of signals.
Red lines indicate channels or trend lines that display the current trend and indicate the preferred direction for trading.
The MACD indicator (14,22,3) – histogram and signal line – is a supplementary indicator that can also be used as a source of signals.
Important speeches and reports (contained in the news calendar) can significantly impact the movement of the currency pair. Therefore, during their release, trading should be conducted with maximum caution, or one should exit the market to avoid sharp reversals against preceding movements.
Beginners trading in the forex market should remember that not every trade can be profitable. Developing a clear strategy and practicing money management are key to long-term success in trading.

QUICK LINKS


 Contact Us

