V prvním pololetí letošního roku bylo vyhlášeno 8249 osobních bankrotů, což bylo meziročně o 13 procent více. Zároveň to byl nejvyšší počet od roku 2021. Od začátku ledna do konce června bylo také podáno 8533 návrhů na osobní bankrot, o 12 procent více než ve stejném období loni. Vyplývá to z analýzy, kterou ČTK poskytla společnost CRIF – Czech Credit Bureau na základě dat portálu Informace o firmách.
The EUR/USD currency pair once again failed to continue its upward movement on Thursday, despite being in a bullish trend for three weeks. Of course, this movement can only be termed a "trend" formally, as the euro has managed to gain only about 150 pips over the three weeks with significant difficulty. Thus, this movement resembles a mere correction before another prolonged decline. On Wednesday, the euro broke out of the sideways channel at 1.1362-1.1461, but, as it turned out on Thursday, only to return to it the following day. The volatility of the pair on this day was, as usual, weak, and the market reacted primarily to the secondary Philadelphia Fed business index, which turned out to be four times stronger than forecasts. The retail sales report matched expectations. In total, the dollar gained 30 pips from these two publications.
From a technical perspective, the pair maintains a minimal bullish bias and is positioned above the Ichimoku indicator lines. Thus, a weak upward movement may continue. However, in reality, the price has returned to the sideways channel of 1.1362-1.1461, and the upward movement in recent weeks has been so weak that it is difficult to even discuss it as a trend.
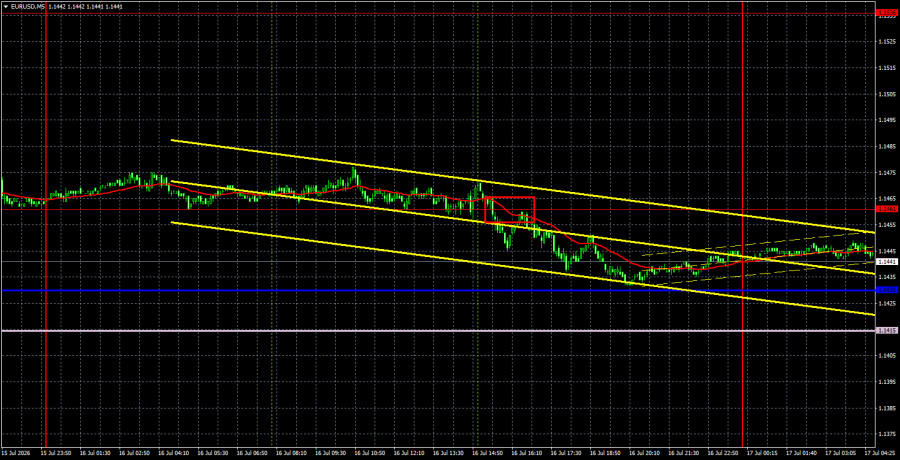
On the 5-minute timeframe on Thursday, one sell signal was formed. During the American trading session, the pair broke the 1.1461 level, and by the end of the day, it had dropped to a critical line. Thus, traders could open a short position that yielded a profit of 10-15 pips by the end of the day.
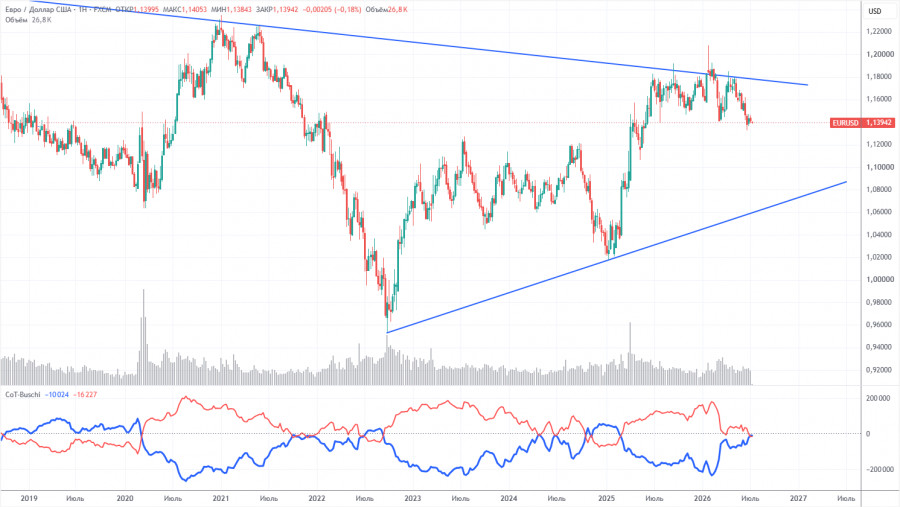
The latest COT report is dated July 7. The illustration on the weekly timeframe clearly shows that the net position of non-commercial traders remains "bullish" but has significantly decreased due to geopolitical events. Traders have been shedding the euro in favor of the U.S. dollar in recent months. Donald Trump's policies have remained unchanged, but for some time the dollar has acted as a "reserve currency." However, this process may already have concluded.
We still do not see any fundamental factors for strengthening the euro, while there are plenty of factors for the dollar's decline. The war in the Middle East made the dollar temporarily super-attractive, but when the "shelf life" of this factor expires, everything will return to normal, and it may have already expired. In the long term, the euro could drop to the level of $1.08 (trend line), but the upward trend will still remain relevant. Moreover, during the recent months of dollar growth, the pair did not get significantly closer to this line.
The positioning of the red and blue lines of the indicator indicates parity between bulls and bears. During the last reporting week, the number of longs for the "Non-commercial" group decreased by 12,200, while the number of shorts increased by 5,100. Consequently, the net position fell by 17,300 contracts over the week.
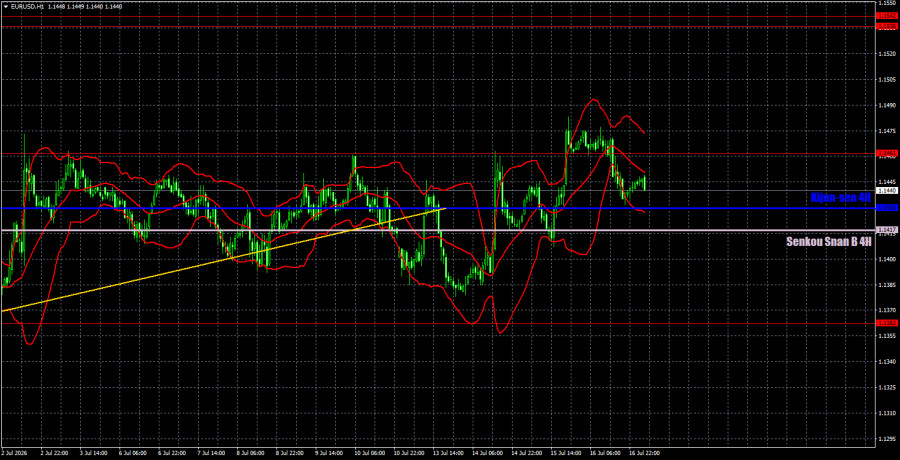
On the hourly timeframe, a corrective upward trend continues to form within a two-month downtrend, and the flat is presumably over. The situation in the Middle East remains tense and has not improved. The market continues to ignore many factors in favor of the euro, but the euro is rising from its knees as the market has reassessed the U.S. dollar. However, the euro's growth appears to be a prelude to a new decline...
For July 17, we highlight the following levels for trading—1.1234, 1.1274, 1.1362, 1.1461, 1.1536-1.1542, 1.1585, 1.1657-1.1666, 1.1750-1.1760, 1.1786, 1.1830-1.1837, as well as the Senkou Span B line (1.1417) and Kijun-sen line (1.1430). The Ichimoku indicator lines may move during the day, which should be considered when determining trading signals. Don't forget to set a Stop Loss order to breakeven if the price moves in the correct direction by 15 pips. This will protect against potential losses if the signal proves false.
On Friday, the U.S. will publish reports on housing starts, building permits, and the consumer sentiment index. In the European Union, a second estimate of inflation for June will be released. All of the above reports are secondary and may provoke only a weak market reaction. The pair's volatility remains low, so strong movements are unlikely.
Today, traders may consider short positions targeting 1.1362 if the price consolidates below the Senkou Span B line. Long positions can be opened with targets at 1.1461 and 1.1480 if the pair bounces off the Ichimoku indicator lines.
Support and resistance price levels – thick red lines around which movement may end. They are not sources of trading signals.
Kijun-sen and Senkou Span B lines – lines of the Ichimoku indicator, transferred to the hourly timeframe from the 4-hour one. They are strong lines.
Extreme levels – thin red lines where the price has previously bounced. They are sources of trading signals.
Yellow lines – trend lines, trend channels, and any other technical patterns.
Indicator 1 on COT charts – the size of the net position for each category of traders.

QUICK LINKS



















 Contact Us