On Thursday, the EUR/USD currency pair managed a small recovery from its lows, but it did not materially improve its dire situation. Essentially, the euro remains at its weakest level
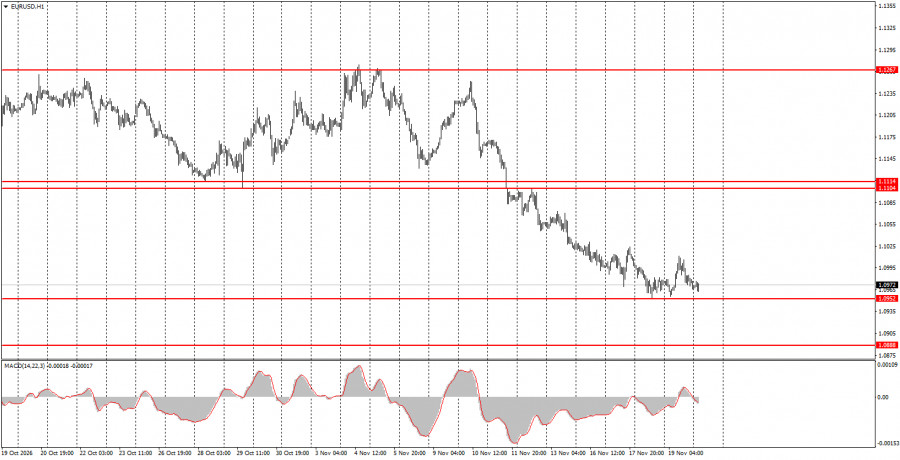
On Thursday, the EUR/USD currency pair managed a small recovery from its lows, but it did not materially improve its dire situation. Essentially, the euro remains at its weakest level in the past year and a half, with no lifeline in sight. The euro continues to weaken for no clear reason. The market keeps ignoring European Central Bank tightening, the easing in geopolitics, positive euro-area reports, and negative US releases. Thus, the euro is in an almost free fall driven by speculative behavior. There were no major releases or events in either the US or the euro area on Thursday, so traders had nothing to react to during the day. Both the ECB and the Federal Reserve maintain hawkish stances, and both central banks are preparing for further tightening in December. That fact provides no support for the euro.
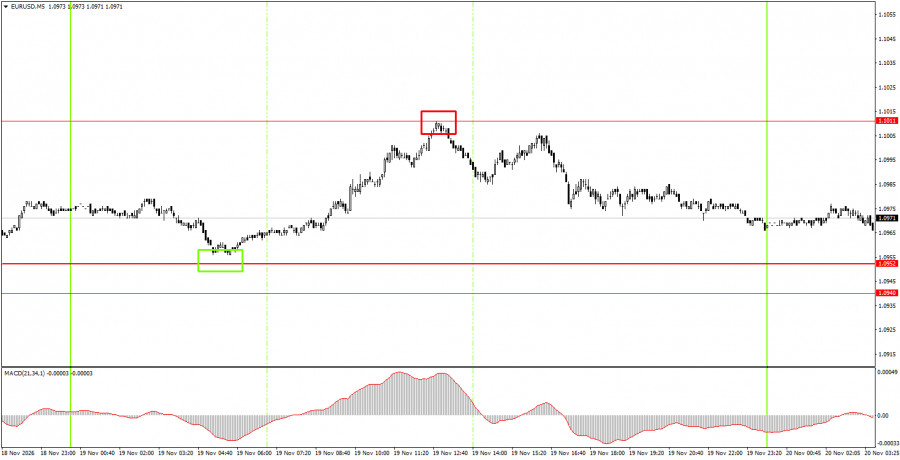
On the 5-minute TF, two excellent trading signals formed on Thursday. During the Asian session, the pair rebounded precisely from the 1.0952 level, and during the European session it rose to 1.1011, then reversed from that area. Thus, novice traders had the opportunity to open long positions first and then short positions. Both trades were profitable.
On the hourly timeframe, the EUR/USD pair has resumed forming a downward trend that has now lasted more than three months. The euro has not managed to correct properly in recent weeks. Considering events over recent months, we do not believe the euro had grounds for such a sustained decline with virtually no correction. At present, the dollar is heavily overbought, and many factors supporting the euro are being ignored.
On Friday, novice traders may consider new short positions if price consolidates below the 1.0940–1.0952 area, targeting 1.0888–1.0896. Open long trades on a rebound from the 1.0940–1.0952 area, targeting 1.1011.
On the 5-minute TF consider the levels 1.0888–1.0896, 1.0940–1.0952, 1.1011, 1.1104–1.1114, 1.1198–1.1218, 1.1267–1.1275, 1.1366–1.1377, 1.1461–1.1474. On Friday, ECB President Christine Lagarde will speak again, and the University of Michigan consumer-sentiment index will be released in the US. We regard both events as secondary; currently, neither fundamentals nor macroeconomics are moving the euro.
Price levels (areas) of support and resistance — levels that serve as targets when opening longs or shorts or as sources of signals.
Red lines — channels or trendlines that display the current trend and indicate the preferred trading direction.
MACD indicator (14,22,3) — histogram and signal line — an auxiliary indicator that can also be used as a source of signals.
Important speeches and reports (listed in the news calendar) can strongly affect a currency pair's movement. Therefore, when they are released, one should trade as cautiously as possible or step aside to avoid a sudden price reversal against the prior direction.
Beginner forex traders should remember that not every trade can be profitable. Developing a clear strategy and money-management rules is the key to long-term success in trading.

QUICK LINKS









 Contact Us