On Thursday, GBP/USD continued its downward move, and the pound is now among the worst performers against the US dollar. The main drop occurred during the US session, even though
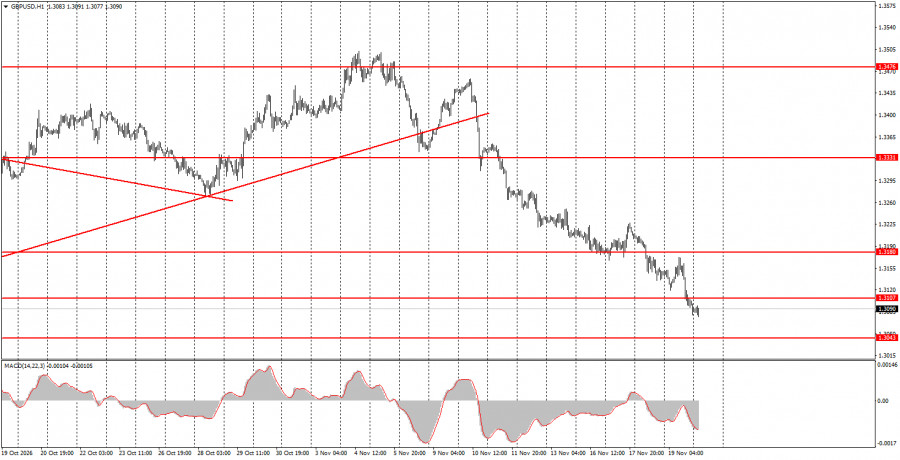
On Thursday, GBP/USD continued its downward move, and the pound is now among the worst performers against the US dollar. The main drop occurred during the US session, even though no major scheduled events were on either the US or UK calendar. The US released jobless claims and the Philadelphia manufacturing index around that time — both came in much worse than forecasts — so those releases could not plausibly have triggered dollar strength. We therefore conclude the pound fell yesterday in the same manner as the euro: without any visible reason. That is not surprising for November 2026, when crypto is plunging, gold and silver are down, and US equity markets are under pressure. The practical approach is to trade on technical factors.
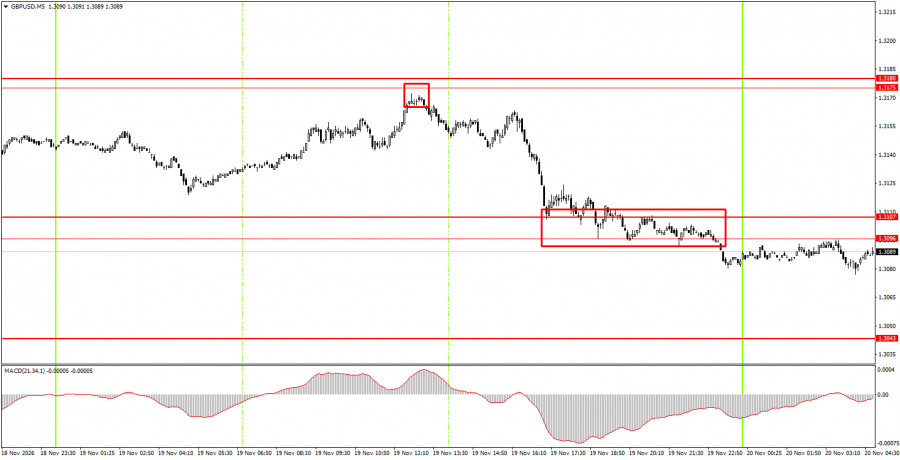
On the 5-minute TF, two trading signals formed on Thursday. First, the pair bounced precisely off the 1.3175–1.3180 area, allowing novice traders to open simple short positions. By day's end, price worked through the 1.3096–1.3107 area and broke it. Traders could either carry short positions into Friday or take profits.
On the hourly TF, GBP/USD formed an upward tendency and slid back to the levels where the previous uptrend began. The technical picture across most charts supports a recovery. Sideways channels on the daily and weekly TFs provide support to the pound via their lower boundaries. Yet the market again shows it is uninterested in factors supportive of the pound.
On Friday, novice traders may remain in short positions targeting 1.3043, since price has consolidated below the 1.3096–1.3107 area. Consider long positions targeting 1.3175–1.3180 if price consolidates above 1.3175–1.3180.
On the 5-minute TF you can trade the levels 1.3043, 1.3096–1.3107, 1.3175–1.3180, 1.3259–1.3267, 1.3319–1.3331, 1.3380–1.3386, 1.3456–1.3476, 1.3587–1.3598, 1.3631–1.3641. The UK will publish retail sales on Friday, and the University of Michigan consumer-sentiment index will be released in the US — we view both as unlikely to change the overall market mood. This week the UK produced two strong reports — on unemployment and inflation — yet the pound continues to fall, ignoring supportive fundamentals.
Price levels (areas) of support and resistance — levels that serve as targets when opening longs or shorts or as sources of signals.
Red lines — channels or trendlines that display the current trend and indicate the preferred trading direction.
MACD indicator (14,22,3) — histogram and signal line — an auxiliary indicator that can also be used as a source of signals.
Important speeches and reports (listed in the news calendar) can strongly affect a currency pair's movement. Therefore, when they are released, one should trade as cautiously as possible or step aside to avoid a sudden price reversal against the prior direction.
Beginner forex traders should remember that not every trade can be profitable. Developing a clear strategy and money-management rules is the key to long-term success in trading.

QUICK LINKS









 Contact Us