Analytici Citi předpokládají, že ceny ropy po nedávném nárůstu v souvislosti s blížící se možností uzavření jaderné dohody mezi USA a Íránem později v tomto roce klesnou.
Ceny ropy Brent vzrostly z nedávných minim na úrovni 60 dolarů nad 66 dolarů za barel, když se zmírnilo obchodní napětí mezi USA a Čínou.
Citi předpokládá, že ceny ropy se budou ve druhém a třetím čtvrtletí letošního roku pohybovat v průměru kolem 62 až 63 dolarů za barel, zejména s ohledem na možné geopolitické dohody mezi USA a Blízkým východem.
Investoři bedlivě sledují amerického prezidenta Donalda Trumpa, který je na cestě po Saúdské Arábii, Kataru a Spojených arabských emirátech.
The EUR/USD currency pair traded very weakly on Tuesday, as if doing someone a favor. Recall that on Monday, it was reported that the US "shutdown" could be completed as early as this week. Republicans and Trump managed to sway 8 Democratic senators to their side, thus gathering the necessary votes in the Upper House of Congress. Now the Lower House must vote, and there is no need for a "super majority" – a "simple majority" will suffice. The Republicans have a "simple majority" in the Lower House, so it is likely that the funding extension bill will be passed today or tomorrow, after which it will be signed by Trump.
It is also important to note that this is not funding for the entire next year, but only until January 31. This was the Democrats' condition, who hope to cancel the cuts to medical and social programs initiated by Trump under the "One Big Beautiful Bill" by that date. If they fail to achieve this, we do not doubt that American lawmakers will head off on another unplanned vacation starting February 1.
Now, let's analyze how the market reacted to this significant event. In short, there was no reaction at all. One might immediately ask all experts why the dollar is not rising on such an important event for the American economy. Many economists have repeatedly devised various reasons to somehow explain the dollar's rise over the past month and a half, which has been completely illogical. Why then is the dollar not rising now, when there are such substantial grounds?
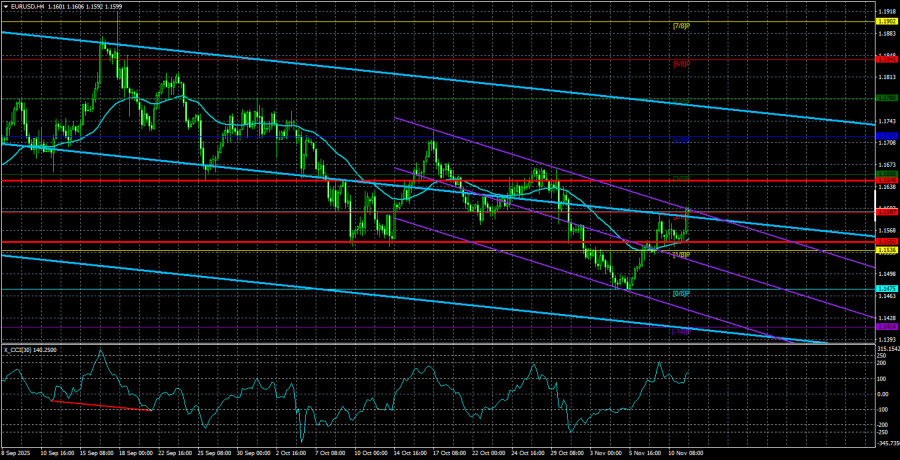
In our view, the answer is simple – the market continues to ignore the entire fundamental background. Perhaps it is awaiting economic data on the US labor market and unemployment, or the actual conclusion of the "shutdown." But in any case, it waits. A flat trend continues on the daily timeframe, which is visible to the naked eye from a kilometer away on a moonless night. Ignoring this flat is the same as justifying the last rise of the dollar. It should not have happened. However, the market has remained within a sideways channel between 1.1400 and 1.1830 for several months, and movements within this range can be purely arbitrary.
A flat is a period when the market reevaluates the old strategy and develops a new one by market makers. The price remains in a limited sideways range not because the fundamental background changes constantly to the opposite when reaching one of the channel's boundaries. Thus, we still believe that the dollar has exhausted its luck, and there are more than enough grounds for its new decline. Even if the EUR/USD pair continues to decline in the medium term, it will still only be a correction, and we cannot advise anyone to open short positions for the future. On the 4-hour timeframe, the CCI indicator has already formed several bullish divergences and has entered the oversold area multiple times. Thus, there are also technical buy signals present.
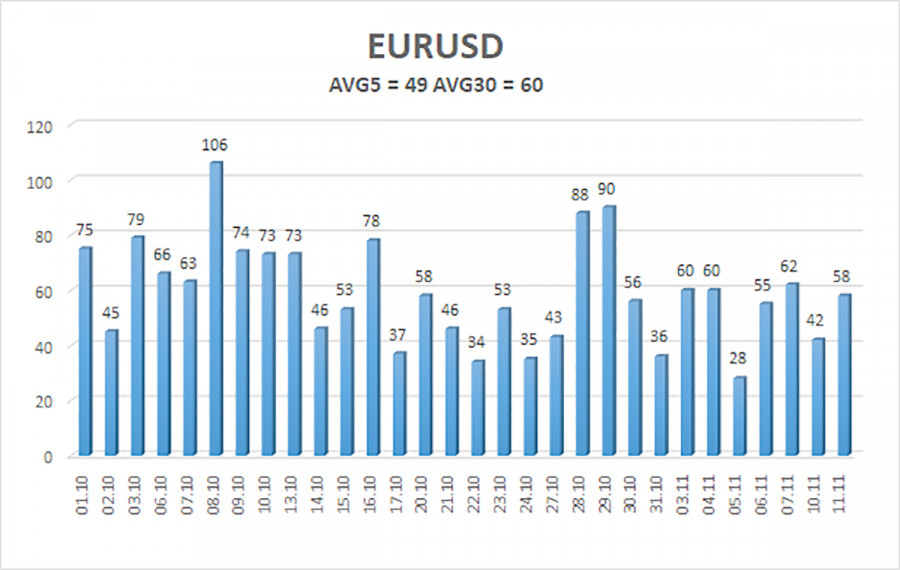
The average volatility of the EUR/USD currency pair over the last five trading days as of November 12 is 49 pips and is characterized as "low." We expect the pair to trade between 1.1550 and 1.1648 on Wednesday. The upper channel of the linear regression points downward, signaling a downward trend, but in reality, a flat continues on the daily timeframe. The CCI indicator entered the oversold area twice in October (!!!), which could provoke a new phase of the upward trend in 2025.
S1 – 1.1536
S2 – 1.1475
S3 – 1.1414
R1 – 1.1597
R2 – 1.1658
R3 – 1.1719
The EUR/USD pair has once again consolidated above the moving average, with an upward trend maintained on all higher timeframes, while a flat has been ongoing on the daily timeframe for several months. The global fundamental background continues to have a substantial impact on the American currency. Recently, the dollar has been rising, but the reasons for this movement may be purely technical. If the price is below the moving average, small short positions can be considered with targets at 1.1475 and 1.1414 on purely technical grounds. Above the moving average line, long positions remain relevant, with a target of 1.1800 (the upper boundary of the flat on the daily timeframe).

RYCHLÉ ODKAZY


 Kontaktujte nás

