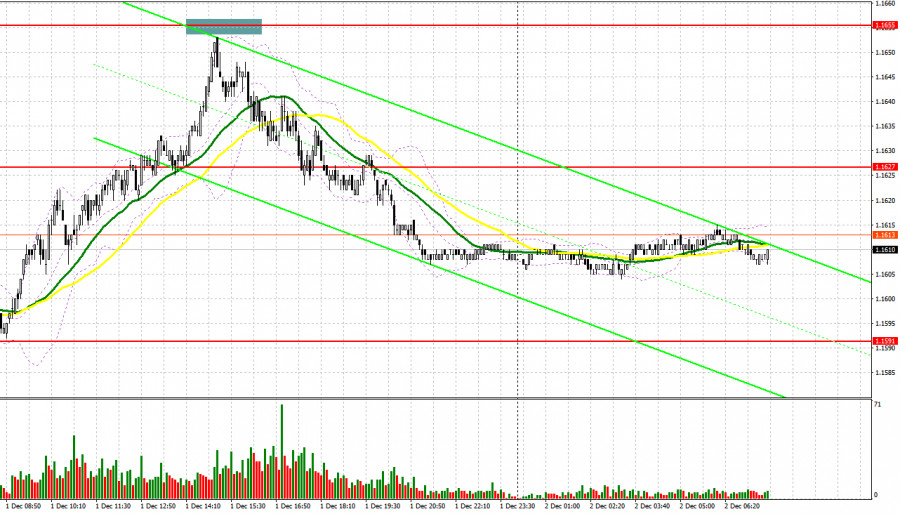
Yesterday, only one entry point in the market was formed. Let's take a look at the 5-minute chart and analyze what happened there. In my morning forecast, I highlighted the level of 1.1613 and planned to make decisions based on it. The rise and formation of a false breakout in the area of 1.1613 led to an entry point for selling the euro, but the pair did not experience a significant drop. In the afternoon, after a sharp rise in the euro, it fell short by a couple of pips from testing 1.1655, leaving me without short positions from that level.
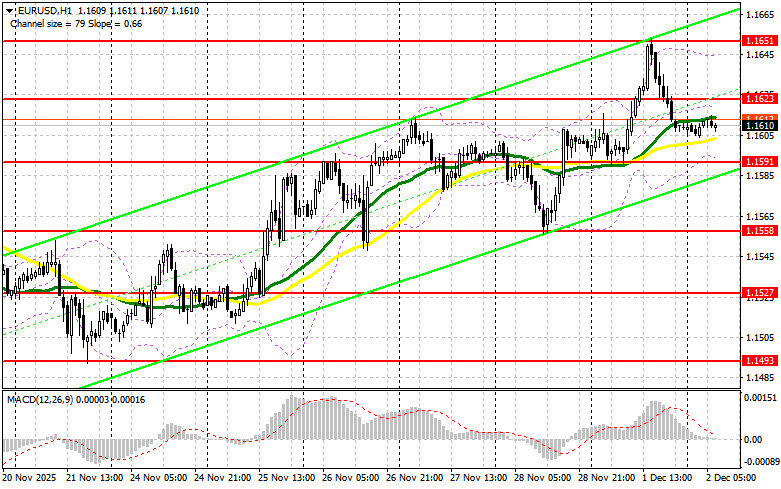
Weak data on the ISM U.S. manufacturing index increased pressure on the U.S. dollar. However, it was unable to hold around last month's highs, which led to a considerable correction of the pair by the end of the day. Today, data on the eurozone consumer price index, core consumer price index, and unemployment rate will be released in the first half of the day. Given that inflation is expected to be around the European Central Bank's target level of 2.0%, it is likely that no excitement around this data will occur, which will maintain the chances for further growth of EUR/USD. In the event of a bearish reaction to the reports, I expect the first signs of euro buyers to appear around the support level of 1.1591, formed at the end of yesterday. A false breakout there would provide an entry point for long positions with the goal of recovering the pair to resistance at 1.1623. A breakout and a reverse test of this range will confirm correct actions for buying euros, anticipating a larger spike of the pair to 1.1651. The furthest target will be the high at 1.1678, where I will take profit. Testing this level will strengthen the bullish market for the euro. In the case of a decline of EUR/USD and a lack of activity around 1.1591, pressure on the pair will increase at the beginning of the month. Sellers will likely reach the next interesting level of 1.1558. Only the formation of a false breakout there will be a suitable condition to buy euros. Long positions will be opened on a bounce from 1.1527, targeting an upward correction of 30-35 pips intraday.
Sellers are active, but they have yet to gain full control of the market. In the case of a bullish reaction to the inflation reports, I expect the first signs of bears to appear only around 1.1623. A false breakout there will provide an entry point for short positions, aiming to move the pair to support at 1.1591. A breakout and consolidation below this range, as well as a reverse test from below, will become another suitable option for opening short positions, targeting the area of 1.1558. The furthest target will be the zone at 1.1527, where I will take profit. In the case of an upward move of EUR/USD, and a lack of active bearish actions around 1.1623, where slightly lower moving averages pass, buyers will get a good opportunity to continue developing the bullish market. In this case, it is best to postpone short positions until a larger level of 1.1651. Selling there will only occur after an unsuccessful consolidation. I plan to open short positions on a bounce from 1.1678, targeting a 30-35-pip downward correction.
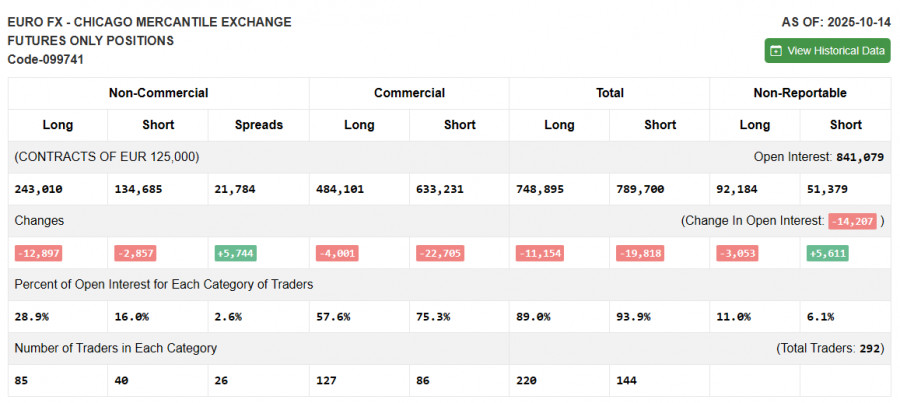
Due to the shutdown in the U.S., fresh data on the Commitment of Traders is not being published. As soon as the latest report is prepared, we will publish it immediately. The last relevant data is only from October 14.
In the COT report (Commitment of Traders), a reduction in both long and short positions was observed. Expectations of further Federal Reserve interest rate cuts continue to pressure the U.S. dollar. The COT report indicates that non-commercial long positions decreased by 12,897 to a level of 243,010, while non-commercial short positions decreased by 2,857 to a level of 134,685. As a result, the spread between long and short positions increased by 5,744.
Moving Averages
Trading is occurring around the 30 and 50-day moving averages, indicating market uncertainty regarding direction.
Note: The period and prices of the moving averages are considered by the author on the hourly chart (H1) and differ from the general definition of classic daily moving averages on the daily chart (D1).
Bollinger Bands
In the case of a decline, the lower boundary of the indicator around 1.1591 will serve as support.

RYCHLÉ ODKAZY


 Kontaktujte nás

