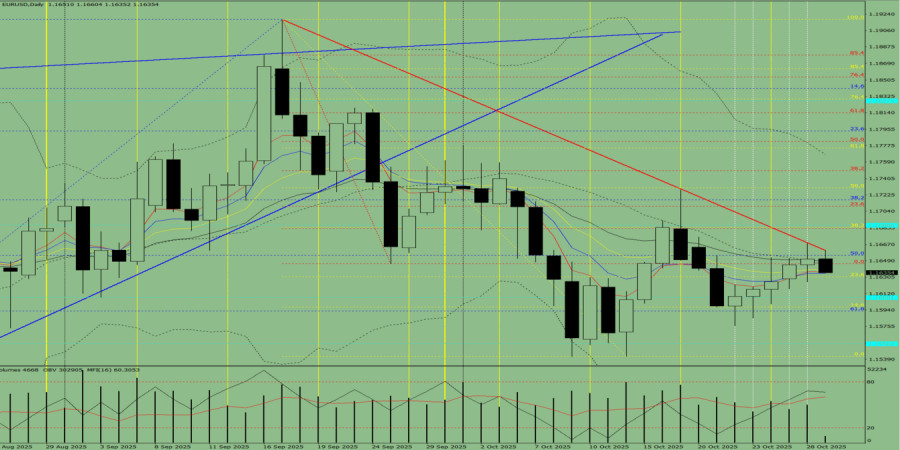
Trend Analysis (Fig. 1)
On Wednesday, the market may start moving downward from the level of 1.1651 (yesterday's daily candle close), aiming for 1.1597 – the 14.6% retracement level (yellow dashed line). When testing this level, the price may possibly rebound upward toward 1.1608 – a historical resistance level (blue dashed line).
Fig. 1 (Daily Chart)
Overall conclusion: downward trend.
Alternative Scenario:
From the level of 1.1651 (yesterday's daily candle close), the price may begin moving downward toward 1.1608 – a historical resistance level (blue dashed line). When testing this level, the price may possibly rebound upward toward 1.1617 – the lower fractal (daily candle from October 27, 2025).

فوری رابطے


 ہم سے رابطہ کریں

