Stock market analytics, financial forecasts

Forexmart's Market Analysis section provides up-to-date information about the financial market. The overviews are intended to give you an insight into current trends, financial forecasts, global economic reports, and political news that influence the market.

Disclaimer:  Information provided here to retail and professional clients does not contain and should not be construed as containing investment advice or an investment recommendation or an offer or solicitation to engage in any transaction or strategy in financial instruments. Past performance is not a guarantee or prediction of future performance.

USD/JPY and EUR/JPY – Technical Analysis Overview
17:34 2025-01-12 UTC--5
Exchange Rates analysis

USD/JPY

Higher Timeframes

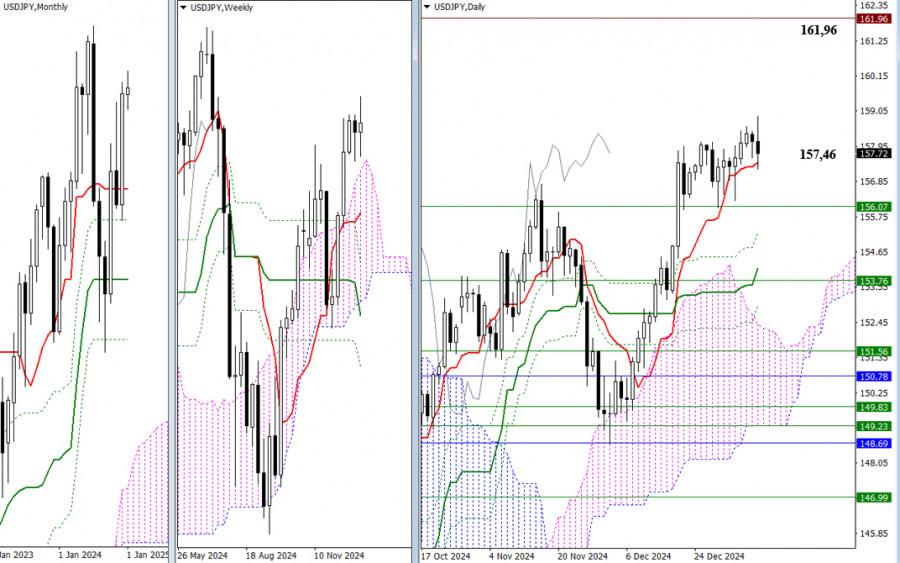
Last year, despite monthly fluctuations that included rises, declines, and recoveries, the market closed with an overall optimistic bullish candlestick, where the upper shadow was slightly longer than the lower shadow. Based on the yearly results, a renewal of the maximum extreme of 2024 at 161.96 could restore and continue the uptrend. This level now serves as the nearest and primary target for bullish traders.

If the bulls lose support at the daily short-term trend of 157.46, a corrective decline could gather momentum, shifting market focus to testing the next support levels of the Ichimoku daily golden cross (155.26, 154.13, and 153.01) with the goal of breaking and neutralizing these levels. At the same time, bearish traders may push into the weekly cloud at 156.07 and test the weekly short-term trend at 153.76.

***

EUR/JPY

analytics6783fb118579a.jpg

Higher Timeframes

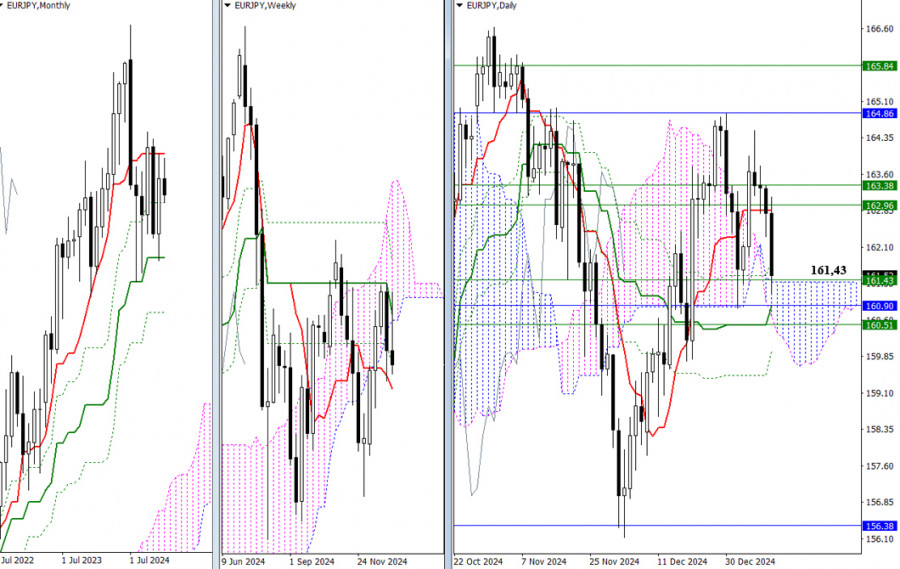
Last year, the pair left a relatively long upper shadow. In 2025, the focus will be on whether the bulls can overcome this shadow and continue the uptrend. Currently, the pair's position is uncertain, with no clear leader. The bears have a slight advantage at present but are encountering a wide support zone where any level could halt the decline and trigger a rebound.

The support zone (161.43 – 161.38 – 160.90 – 160.89 – 160.51 – 160.33 – 159.96) includes levels from various timeframes.

Similarly, the bulls face significant challenges with a resistance zone overhead (162.85 – 162.96 – 163.38 – 164.86 – 165.84), which comprises levels from multiple timeframes. If they can successfully overcome this resistance zone, the pair will be closer to the nearest maximum high at 166.63 and will meet the breakout target of the daily cloud. This scenario would be supported by a rebound from the current support level at 161.43.

***

Technical Analysis Components:

  • Higher Timeframes: Ichimoku Kinko Hyo (9.26.52) and Fibonacci Kijun levels
  • H1: Classic Pivot Points and 120-period Moving Average (weekly long-term trend)
Feedback

ForexMart is authorized and regulated in various jurisdictions.

(Reg No.23071, IBC 2015) with a registered office at Shamrock Lodge, Murray Road, Kingstown, Saint Vincent and the Grenadines

Restricted Regions: the United States of America, North Korea, Sudan, Syria and some other regions.


© 2015-2025 Tradomart SV Ltd.
Top Top
Risk Warning:
Foreign exchange trading carries a high risk of losing money due to leverage and may not be suitable for all investors. Before deciding to invest your money, you should carefully consider all the features associated with Forex, as well as your investment objectives, level of experience, and risk tolerance.