تجزیاتی جائزے

فارکس مارٹ کے تجزیاتی جائزے مالی بازار کے بارے میں جدید ترین تکنیکی معلومات فراہم کرتے ہیں۔ یہ رپورٹیں سٹاک کے رجحانات سے لے کر، مالی پیش گوئی ، عالمی معیشت کی رپورٹیں ، اور سیاسی خبروں تک جو بازارکو متاثر کرتی ہیں۔

Disclaimer:   فارکس مارٹ سرمایہ کاری کے مشورے کی پیش کش نہیں کرتا ہے اور فراہم کردہ تجزیہ کو مستقبل کے نتائج کے وعدے کے طور پر نہیں سمجھا جانا چاہئے۔

USD/JPY and EUR/JPY – Technical Analysis Overview
17:34 2025-01-12 UTC--5

USD/JPY

Higher Timeframes

Last year, despite monthly fluctuations that included rises, declines, and recoveries, the market closed with an overall optimistic bullish candlestick, where the upper shadow was slightly longer than the lower shadow. Based on the yearly results, a renewal of the maximum extreme of 2024 at 161.96 could restore and continue the uptrend. This level now serves as the nearest and primary target for bullish traders.

If the bulls lose support at the daily short-term trend of 157.46, a corrective decline could gather momentum, shifting market focus to testing the next support levels of the Ichimoku daily golden cross (155.26, 154.13, and 153.01) with the goal of breaking and neutralizing these levels. At the same time, bearish traders may push into the weekly cloud at 156.07 and test the weekly short-term trend at 153.76.

***
EUR/JPY

analytics6783fb118579a.jpg

Higher Timeframes

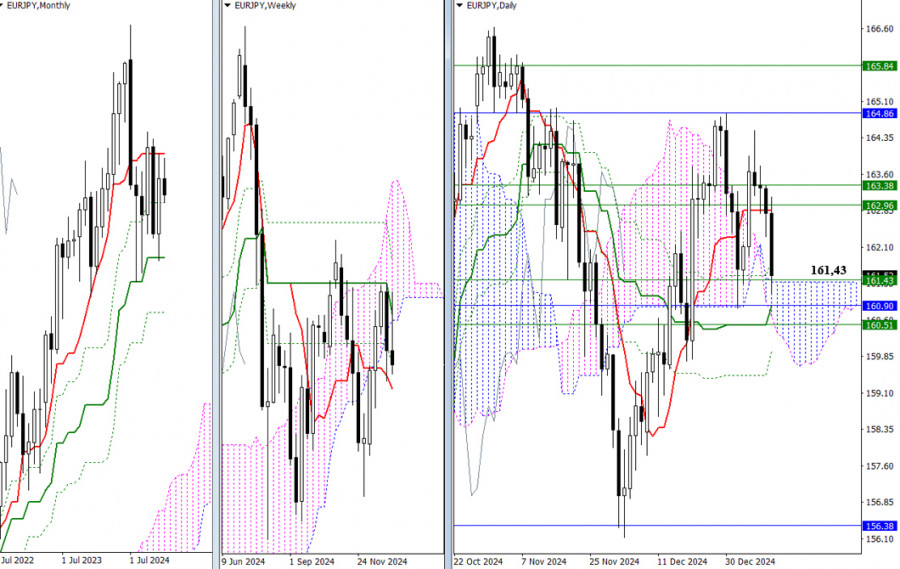
Last year, the pair left a relatively long upper shadow. In 2025, the focus will be on whether the bulls can overcome this shadow and continue the uptrend. Currently, the pair's position is uncertain, with no clear leader. The bears have a slight advantage at present but are encountering a wide support zone where any level could halt the decline and trigger a rebound.

The support zone (161.43 – 161.38 – 160.90 – 160.89 – 160.51 – 160.33 – 159.96) includes levels from various timeframes.

Similarly, the bulls face significant challenges with a resistance zone overhead (162.85 – 162.96 – 163.38 – 164.86 – 165.84), which comprises levels from multiple timeframes. If they can successfully overcome this resistance zone, the pair will be closer to the nearest maximum high at 166.63 and will meet the breakout target of the daily cloud. This scenario would be supported by a rebound from the current support level at 161.43.

***

Technical Analysis Components:

  • Higher Timeframes: Ichimoku Kinko Hyo (9.26.52) and Fibonacci Kijun levels
  • H1: Classic Pivot Points and 120-period Moving Average (weekly long-term trend)
آراء

ForexMart is authorized and regulated in various jurisdictions.

(Reg No.23071, IBC 2015) with a registered office at Shamrock Lodge, Murray Road, Kingstown, Saint Vincent and the Grenadines

Restricted Regions: the United States of America, North Korea, Sudan, Syria and some other regions.


© 2015-2025 Tradomart SV Ltd.
Top Top
خطرہ کی انتباہ 58#&؛
غیر ملکی تبادلہ قدرتی لحاظ سے انتہائی قیاس آرائی اور پیچیدہ ہے ، اور یہ تمام سرمایہ کاروں کے لئے موزوں نہیں ہوسکتا ہے۔ فاریکس ٹریڈنگ کے نتیجے میں خاطر خواہ فائدہ یا نقصان ہوسکتا ہے۔ لہذا ، آپ کو ضائع کرنے کی رقم برداشت کرنے کی صلاح نہیں دی جاتی ہے۔ فاریکس مارٹ کی پیش کردہ خدمات کو استعمال کرنے سے پہلے ، براہ کرم فاریکس ٹریڈنگ سے وابستہ خطرات کو تسلیم کریں۔ اگر ضروری ہو تو آزاد مالی مشورے حاصل کریں۔ براہ کرم نوٹ کریں کہ نہ تو ماضی کی کارکردگی اور نہ ہی پیش گوئیاں مستقبل کے نتائج کے قابل اعتماد اشارے ہیں۔