On Friday, the EUR/USD currency pair began an upward movement after a week of correction. There was no macroeconomic backdrop on that day, and very few geopolitical news items were received. The market is currently paying no attention to secondary news. The geopolitical situation in the Middle East remains unchanged, with negotiations between Iran and the US stalled and the Strait of Hormuz still blocked. Thus, the past week was dedicated to correction. This week, however, there will be a plethora of significant events and reports from the Eurozone and the US, but there is no guarantee that the market will respond to them or pay any attention. No important news or reports are expected on Monday. The day and week began with a slight rise in the pair, and overall, we continue to expect growth only for the euro. Currently, geopolitics has no substantial influence on the dollar's exchange rate.
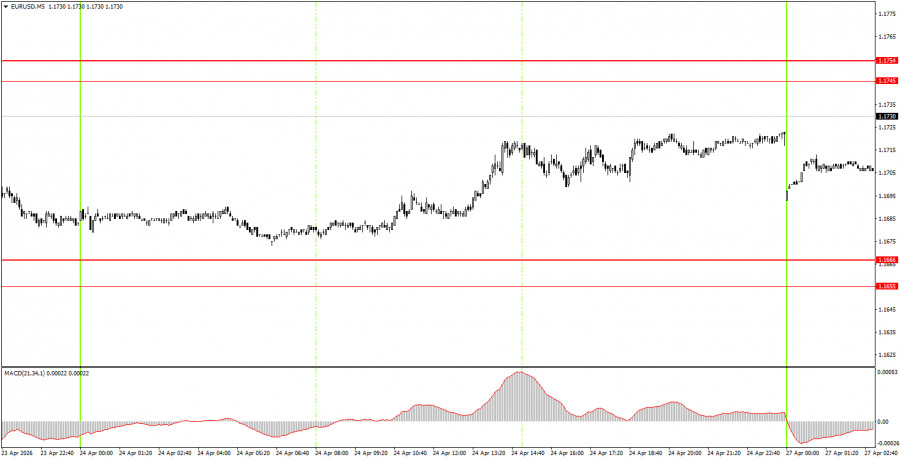
On the 5-minute timeframe, no trading signals were generated on Friday. During the European trading session, the price approached the area of 1.1655-1.1666 but fell short by 6 pips, which is considerable in terms of margin. Therefore, there were no grounds for beginners to open trades.
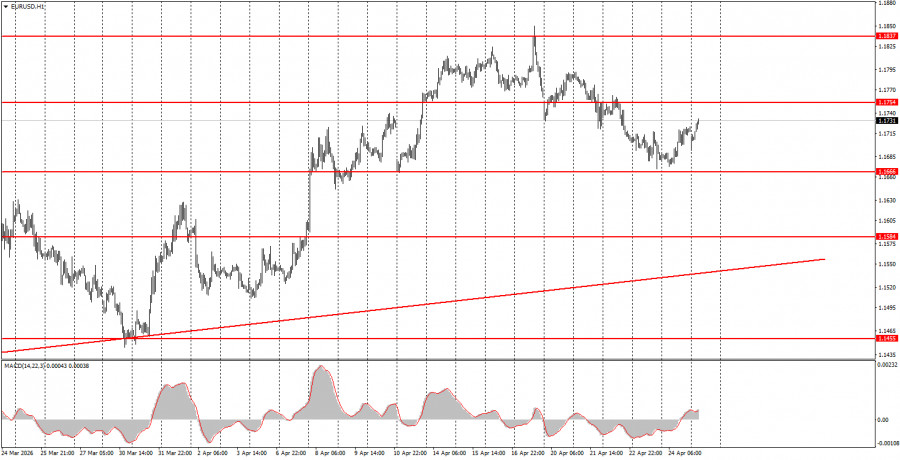
On the hourly timeframe, the upward trend remains intact. For two consecutive weeks, the market has sold off the dollar while geopolitics has receded somewhat into the background. However, geopolitical tensions are worsening again, and the U.S. dollar may again be in demand as a safe haven. We believe the reason is technical, but in any case, traders have technical levels to trade from, and movements will depend on the developments in the Middle East.
On Monday, beginner traders can open short positions if the price bounces from the 1.1745-1.1754 area, targeting 1.1655-1.1666. New long positions can be considered if the price consolidates above the 1.1745-1.1754 area, with a target of 1.1830-1.1837.
On the 5-minute timeframe, levels to consider for trading include 1.1354-1.1363, 1.1413, 1.1455-1.1474, 1.1527-1.1531, 1.1584-1.1591, 1.1655-1.1666, 1.1745-1.1754, 1.1830-1.1837, and 1.1899-1.1908. No important events or reports are scheduled for Monday in either the US or the EU. Furthermore, no geopolitical news is expected. Most likely, we will experience a "boring Monday."
Price levels of support and resistance are levels that serve as targets when opening buys or sells. Take Profit levels can be placed around them.
Red lines represent channels or trend lines that show the current trend and indicate the direction in which it is preferable to trade now.
The MACD indicator (14,22,3) – the histogram and the signal line – is a supporting indicator that can also be used as a source of signals.
Important speeches and reports (always included in the news calendar) can significantly affect the movement of the currency pair. Therefore, during their release, trading should be done with utmost caution, or traders should exit the market to avoid sharp price reversals against the previous movement.
Beginning traders in the forex market should remember that not every trade can be profitable. Developing a clear strategy and effective money management are the keys to long-term trading success.

QUICK LINKS


 Contact Us

