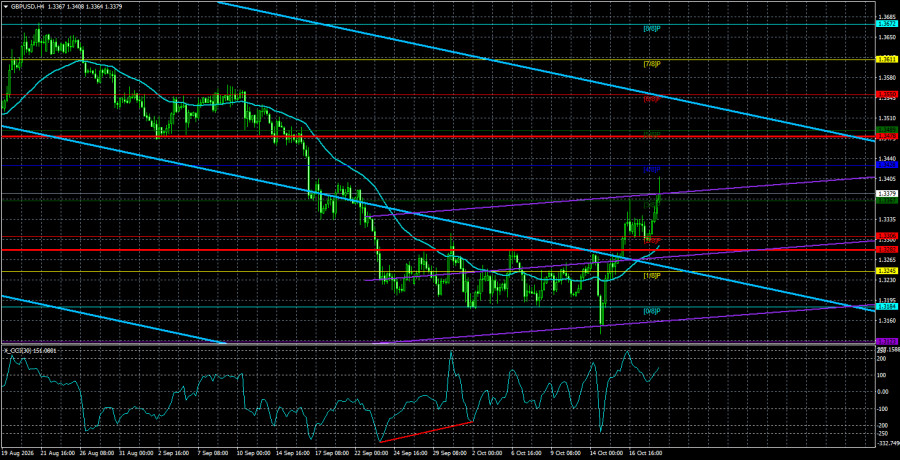
The GBP/USD pair traded quietly on Tuesday, and UK morning data provided only short-lived support for sterling. As we expected, Tuesday's macro prints did not provoke a big market reaction. The UK unemployment rate fell to 4.7%, but unemployment alone does not determine Bank of England policy or market sentiment right now. Remember the BoE could begin tightening in early November — a possibility the market has largely ignored, just as it has ignored recent European Central Bank tightening. If the market wanted to buy sterling, it could have done so in September; if it doesn't, even a much lower unemployment rate wouldn't necessarily lift the pound.
In our view, technicals, not fundamentals or macro data, remain the key driver for the pound. The market has shown it pays more attention to technical formations on higher timeframes than to central-bank plans. On the weekly chart, a sideways channel persists in the 1.3150–1.3780 area; on the daily chart, a sideways channel remains in 1.3160–1.3650. In both cases, the pair has bounced from the lower edge of the channel, so it is reasonable to expect a move toward each channel's upper boundary. Also note that a week ago we saw not just a bounce, but the removal of liquidity on the daily timeframe—again. In June price took out March lows; in October it removed June lows. A flat cannot and will not continue forever, but it ends with a decisive break of one channel boundary.
Suppose the lower boundary is broken. On what fundamental grounds would the dollar then continue to rise? Obviously, another geopolitical shock — for example, a new US military action — would lift the dollar and justify such a move. But what are the reasons now? Sterling also lacks clear fundamental drivers for a new long-term leg higher. On its side, it has (1) the flat with price positioned at the lower edge and (2) many unworked positive factors — notably the prospect of BoE tightening.
Also remember, trends don't always require immediate news or events to persist. For example, the dollar rose from 2007 to 2022 — from about $2.12 per pound nearly to parity — effectively doubling. It's hard to argue that UK fundamentals were catastrophically worse throughout that period; global trends can move prices on their own. Traders see a long-term case for sterling and buy it. Thus, until price decisively breaks below the 1.3100–1.3160 area, our bias remains bullish.
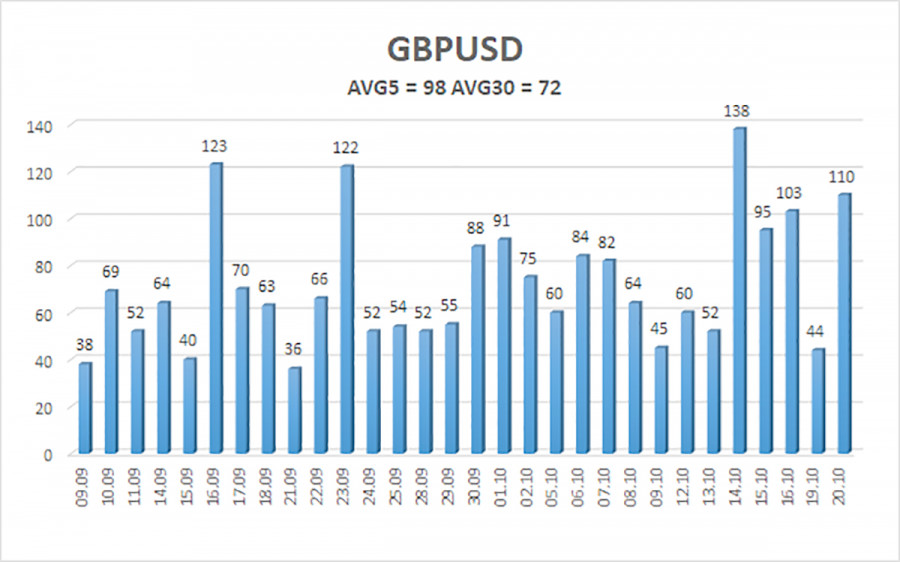
The average volatility of the GBP/USD pair over the last 5 trading days is 98 pips. For the pound/dollar pair, this value is "average." On Wednesday, October 21, we therefore expect movement inside a range bounded by 1.3282 and 1.3478. The higher linear-regression channel has turned down again. The CCI indicator entered the oversold area twice and formed a "bullish" divergence, which warns of a possible end to the downtrend.
S1 – 1.3306
S2 – 1.3245
S3 – 1.3184
R1 – 1.3367
R2 – 1.3428
R3 – 1.3489
The GBP/USD pair has begun an upward move that could develop into a longer-term trend. Donald Trump's policies will continue to exert pressure on the US economy, so we do not expect long-term dollar strength. So far, 2026 has been favorable for the dollar because geopolitics and inflation forced capital to seek safety and prompted the Federal Reserve to return to monetary tightening. However, on the weekly timeframe, a flat range between 1.3150 and 1.3780 persists within a four-year uptrend, supporting expectations for medium-term sterling appreciation. Consider long positions with targets of 1.3428 and 1.3478 if price is above the moving average. Price below the moving average allows bearish trading, with targets of 1.3245 and 1.3184.

QUICK LINKS









 Contact Us