GOLD
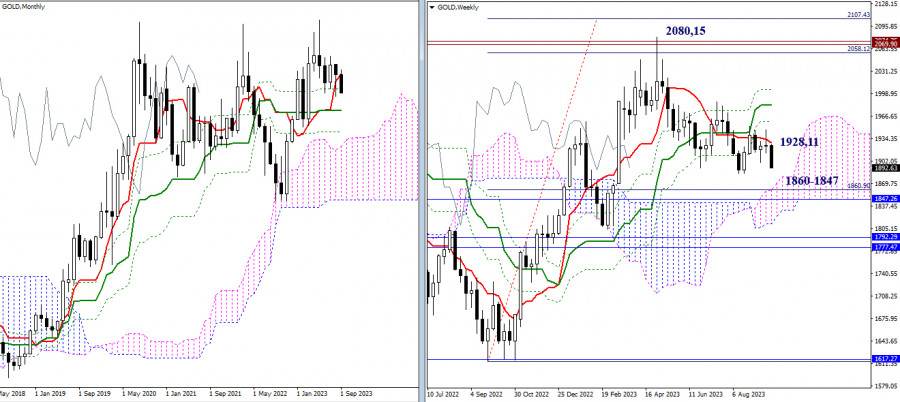
In May 2023, gold reached a historical high (2080.15), surpassing previous highs (2074.25 - 2069.90). At the same time, the target for breaking the weekly Ichimoku cloud at the first target level (2058.12) was achieved. After testing these crucial levels, bullish players took a pause. This resulted in a corrective decline to monthly support levels (1942.22 - 1902.22) and the elimination of the golden cross on the weekly chart. If bullish players attempt to regain their positions in the current conditions, the levels of the new death cross on the weekly Ichimoku chart (1928.11 - 1959.12 - 1982.23 - 2005.34) will now act as resistance points on this path.
If the decline continues, the nearest important task for bearish players in this chart section will be testing the weekly Ichimoku cloud (1859.77 - 1811.83), reinforced by monthly medium-term trend support (1847.26). The outcome of this interaction could influence future developments.
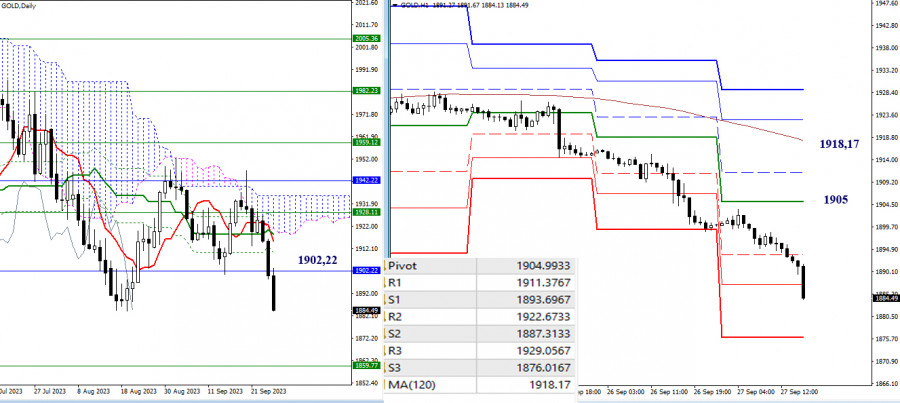
On the daily timeframe, the Ichimoku cloud has recently been assisting bearish players. It has several times reflected the attempts of bullish players to enter the bullish zone relative to the cloud. As a result, gold is now aiming to restore the downward trend (1884.31).
On lower timeframes, the downward trend is currently developing. The second support of classic pivot points has been tested (1887.31), and after a breakout, attention will be directed to S3 (1876.02). Key levels on lower timeframes today are within the range of 1904.99 (central pivot point of the day) - 1918.17 (weekly long-term trend). These levels are reinforced by monthly resistance (1902.22), so the task of changing the existing balance of power here is not an easy one.
To summarize the current analysis, bearish players have the upper hand on many timeframes. Their next significant downward target is currently at the level of 1859.77 (upper boundary of the weekly cloud). Sentiments and priorities may begin to change only when bullish players manage to regain key levels on lower timeframes, specifically 1904.99 (central pivot point of the day) - 1918.17 (weekly long-term trend), which are reinforced by monthly resistance (1902.22).
The technical analysis of the situation uses:
Higher timeframes - Ichimoku Kinko Hyo (9.26.52) + Fibo Kijun levels
H1 - Pivot Points (classic) + Moving Average 120 (weekly long-term trend)

روابط سريعة


 وماهو رأيك

