The EUR/USD currency pair did not move at all on Friday. There was some movement during the U.S. trading session, but it was not significant. Notable macroeconomic events included the U.S. new home sales report and the University of Michigan consumer sentiment index. Both reports came in weaker than expected, but as one might guess, the market showed virtually no reaction. The U.S. dollar fell by 30 pips after its publication and then rose by the same amount by the end of the day. Thus ended the super-important week that was expected to provoke a "storm" in the market.
From a technical perspective, the upward trend remains intact, but we may see chaotic market movements next week. Therefore, the price may easily settle below the Senkou Span B line, indicating a cancellation of the bullish scenario. It is important to note that the pair has been in a trading range for 6 months on the daily timeframe, so a new short-term downward trend would be entirely justified technically, particularly given that the price has failed to break through the 1.1800-1.1830 range (the upper boundary of the flat range).
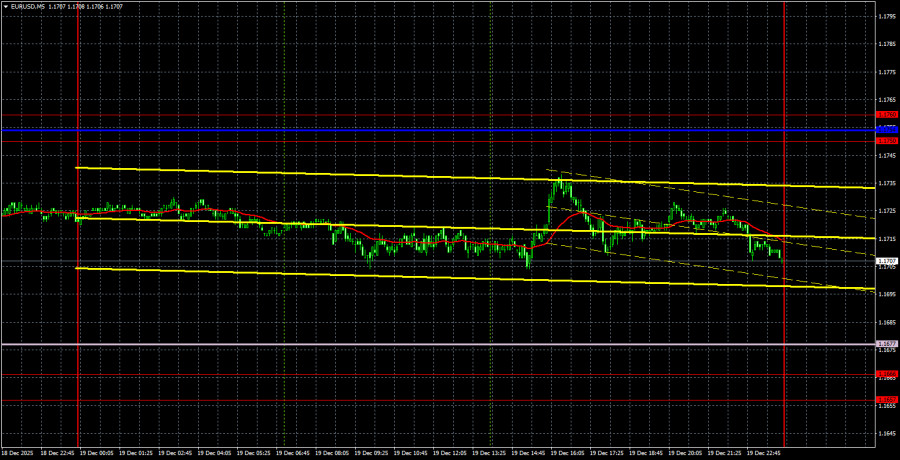
On the 5-minute timeframe, no trading signals were formed on Friday, so there were no reasons for traders to enter the market.
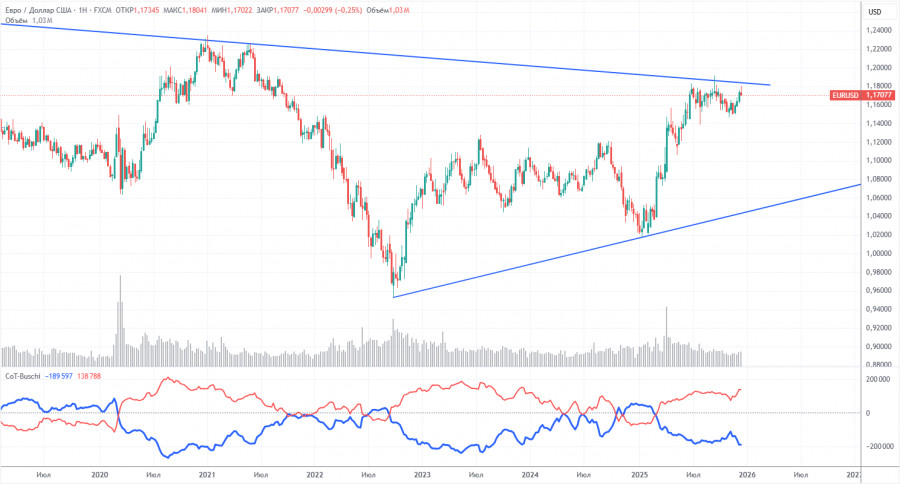
The latest COT report was released last week and is dated December 9. As illustrated, the net position of non-commercial traders has long been "bullish," with bears struggling to enter a zone of their own superiority at the end of 2024, only to lose it quickly. Since Trump took office as President of the United States for a second time, the dollar has been in decline. We cannot state with 100% certainty that the U.S. currency's downward trend will continue, but current developments worldwide suggest this is a possibility.
We still do not see any fundamental factors supporting the strengthening of the euro, while there are sufficient factors for the dollar's decline. The global downward trend remains intact, but what relevance does the price movement over the last 17 years have now? The dollar may strengthen if the global fundamental picture changes, but there are currently no signs of that.
The location of the red and blue lines of the indicator continues to indicate the persistence of a "bullish" trend. Over the last reporting week, the number of longs in the "Non-commercial" group increased by 18,400, while the number of shorts decreased by 11,900. Consequently, the net position increased by 30,300 contracts over the week.
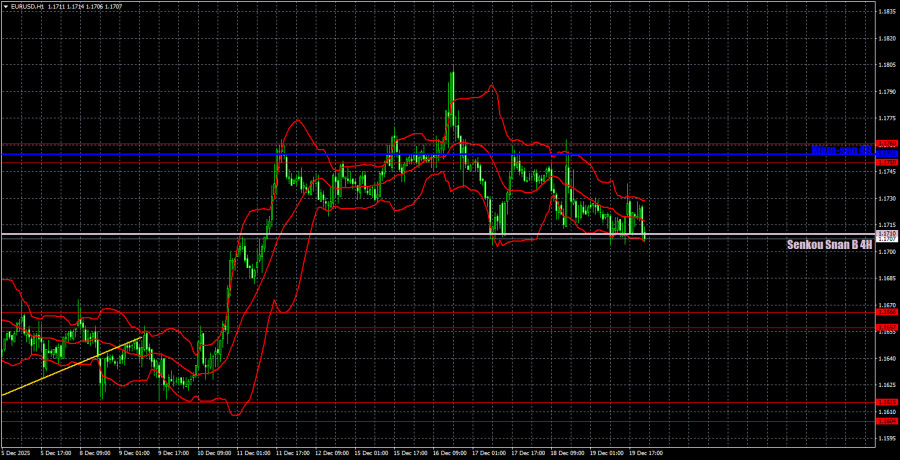
On the hourly timeframe, the EUR/USD pair maintains an upward trend. The upper line of the sideways channel (1.1400-1.1830) has been tested, and we may now observe a technical decline, as the flat market persists on the daily timeframe. Essentially, we have seen a reversal near the upper boundary of the channel, which means we can now expect movement toward the lower boundary. A consolidation below the Senkou Span B line will confirm the market's near-term bearish outlook.
On December 22, we highlight the following trading levels: 1.1234, 1.1274, 1.1362, 1.1426, 1.1542, 1.1604-1.1615, 1.1657-1.1666, 1.1750-1.1760, 1.1846-1.1857, 1.1922, 1.1971-1.1988, as well as the Senkou Span B line (1.1710) and the Kijun-sen line (1.1755). The lines of the Ichimoku indicator may shift throughout the day, which should be taken into account when determining trading signals. Don't forget to set a Stop Loss order at breakeven if the price moves in the desired direction by 15 pips. This will safeguard against potential losses if the signal turns out to be false.
On Monday, there are no significant events or reports scheduled in the Eurozone or the U.S., so volatility is unlikely to be significantly higher than on Friday.
On Monday, traders can trade from the Senkou Span B line. A bounce from this line will make long positions relevant with a target in the area of 1.1750-1.1760. A consolidation below this line will lead to a decline with a target at 1.1657-1.1666. However, as noted, significant movement should not be expected today.


 আমাদের সাথে যোগাযোগ করুন

