(Reuters) – Společnost Apple se v prvním čtvrtletí dostala na první místo v celosvětovém prodeji chytrých telefonů díky uvedení iPhonu 16e na trh a silné poptávce v zemích, jako je Japonsko a Indie, ukázaly pondělní údaje společnosti Counterpoint Research.
Podle společnosti Counterpoint měla společnost Apple (NASDAQ:AAPL) 19% podíl na trhu s chytrými telefony, a to i přes stagnující nebo klesající prodeje v USA, Evropě a Číně, následovaná společností Samsung (KS:005930) s 18% podílem na trhu.
Údaje naznačují, že poptávka po iPhonech zůstává na rozvíjejících se trzích silná, i když v Číně se prodeje potýkají s problémy kvůli konkurenci místních hráčů, jako je Huawei, a nedostatku funkcí umělé inteligence.
Samostatně společnost International Data Corporation, která primárně sleduje dodávky, nikoli prodeje spotřebitelům, uvedla, že globální dodávky chytrých telefonů v prvním čtvrtletí vzrostly o 1,5 %, přičemž Apple předzásobil dodávky, aby se vyhnul potenciálním clům za vlády amerického prezidenta Donalda Trumpa.
The EUR/USD currency pair maintained its bearish bias on Wednesday. We will discuss all the day's macroeconomic reports in our other articles; this article focuses on the key event of the week. No, it's not the Federal Reserve meeting, which in 2025 has had no impact on the dollar's exchange rate due to ongoing geopolitical and trade conflicts.
On Monday, Donald Trump and Ursula von der Leyen announced the signing of a "historic trade agreement." According to this deal, "everything" goes to America, and "nothing" to the European Union. Tariffs on European exports to the U.S. not only remained in place but increased compared to the "grace period," and in addition to tariffs, Brussels committed to a series of financial conditions. In particular, Europe pledged to purchase $750 billion worth of energy resources from the U.S. over the next three years.
As is often the case, things look great on paper, but once you begin digging into the details, a series of questions emerges. The first and most pressing: how does the European government plan to force private companies to buy oil and gas from the U.S. at significantly higher prices than from other suppliers? Let's recall that European companies are not state-owned — they are public or private firms that independently decide where and what raw materials to purchase. Any business aims to minimize costs, yet Ursula von der Leyen signed a deal that effectively obliges European producers to buy oil and gas from the U.S.
Last year, the countries of the Alliance purchased $75 billion worth of oil and gas from the U.S., and a total of nearly $450 billion worth of energy imports overall. This means European producers will have to increase their imports from the U.S. several times over — at much higher prices — which will make their products more expensive. Naturally, this is unprofitable for businesses, especially considering a likely decline in demand for their goods in the U.S. due to Trump's tariffs.
It gets even more interesting. Trump wants oil prices to be lower than they are now. If oil prices do indeed fall, then the European Union would need to buy even more crude to reach the target of $250 billion per year. What should be done with all that purchased oil? Sell it eastward, where oil is already abundant? That question remains unanswered.
It's also worth noting that Europe has long been pursuing a "green energy" strategy, which essentially aims to reduce consumption of coal, gas, oil, and other polluting energy sources. So how is the EU supposed to significantly increase energy imports when its own agenda is focused on reducing such consumption? There are more questions than answers. It appears that von der Leyen signed the agreement provided by Trump without closely examining its details. All the figures mentioned in the deal are far too round to be considered economically sound or thoroughly calculated.
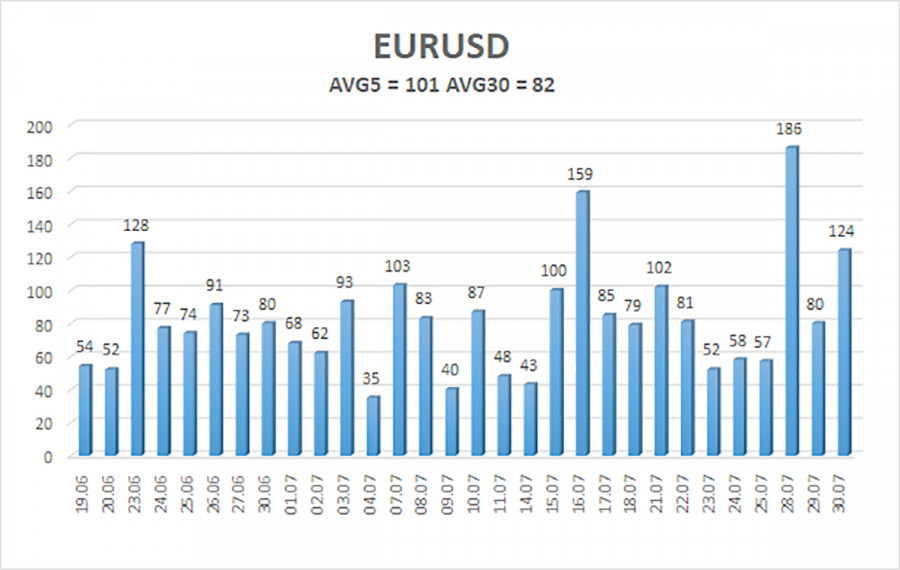
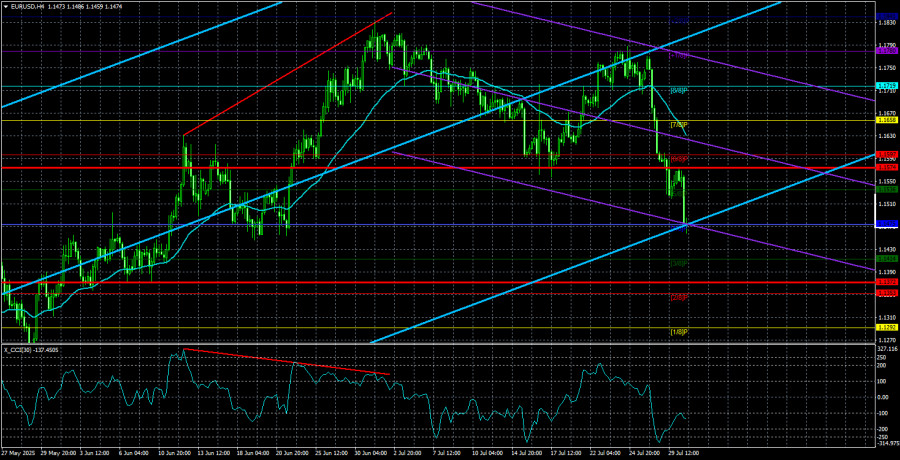
The average volatility of the EUR/USD currency pair over the past five trading days, as of July 31, is 101 pips, which is classified as "high." We expect the pair to move between the levels of 1.1372 and 1.1574 on Thursday. The long-term linear regression channel is directed upward, which still points to a bullish trend. The CCI indicator has once again entered oversold territory, signaling a potential resumption of the uptrend.
S1 – 1.1475
S2 – 1.1414
S3 – 1.1353
R1 – 1.1536
R2 – 1.1597
R3 – 1.1658
The EUR/USD pair has entered a new wave of corrective movement. Trump's policies — both foreign and domestic — continue to exert intense pressure on the U.S. dollar. Although the dollar has risen this week, we still see no case for medium-term buying.
If the price is below the moving average, short positions can be considered with targets at 1.1414 and 1.1372. If the price is above the moving average, long positions remain relevant with targets at 1.1719 and 1.1780, in continuation of the trend.
Linear Regression Channels help determine the current trend. If both channels are aligned, it indicates a strong trend.
Moving Average Line (settings: 20,0, smoothed) defines the short-term trend and guides the trading direction.
Murray Levels act as target levels for movements and corrections.
Volatility Levels (red lines) represent the likely price range for the pair over the next 24 hours based on current volatility readings.
CCI Indicator: If it enters the oversold region (below -250) or overbought region (above +250), it signals an impending trend reversal in the opposite direction.

RYCHLÉ ODKAZY


 Kontaktujte nás

