General Motors (GM) a Ford Motor se chystají zveřejnit své finanční výsledky za 3. čtvrtletí, přičemž obě automobilky čelí problémům na trhu. Generální ředitelka GM Mary Barra uvedla, že ziskové marže u vozidel na benzinový pohon nedosáhly svého vrcholu a že prodeje elektromobilů (EV) rostou. Tento pozitivní výhled zvýšil akcie GM v letošním roce o více než třetinu. Naproti tomu Ford se potýká s problémy s kvalitou a miliardovými ztrátami ze svých podniků v oblasti elektromobilů, což způsobilo pokles jeho akcií o 8 % v roce 2021. Analytici Deutsche Bank předpovídají, že Ford může zaostávat za očekáváním kvůli nadměrným zásobám. Trh také vyjádřil obavy z vysokých cen nákladních automobilů a SUV v prostředí vysokých úrokových sazeb a ekonomické nejistoty. Průměrná kótovaná cena nového vozu se však za poslední rok zvýšila pouze o zhruba 1 %, což naznačuje, že ceny možná dosáhly stropu. Obě automobilky se zaměřily na výrobu modelů s vyšší marží poháněných benzinovými motory, protože růst prodeje elektrických vozidel se zpomaluje. Kromě toho GM a Ford získaly podíl na trhu od konkurenčního Stellantisu, jehož prodeje v Severní Americe zaostávají. Investoři a analytici budou pozorně sledovat dopad ekonomiky na chování spotřebitelů, zejména vzhledem k tomu, že nedošlo k výraznému zlepšení úrokových sazeb u úvěrů na automobily nebo cenové dostupnosti nových vozidel. Kromě toho se preference spotřebitelů přesunuly ke kompaktním crossoverům kvůli jejich nižším nákladům na údržbu a lepší spotřebě paliva. Analytici odhadují, že tržby GM ve třetím čtvrtletí vzrostou přibližně o 1 % na 44,5 miliardy dolarů a odhadovaný zisk na akcii (EPS) bude 2,46 dolaru. U společnosti Ford analytici očekávají 2% růst tržeb na 42 miliard USD s odhadovaným ziskem na akcii (EPS) ve výši 0,48 USD.
On Monday, the GBP/USD pair managed to show even lower volatility than the EUR/USD pair, with only 37 pips. Therefore, there is no point in analyzing the movements because there simply weren't any. Trading volume was thin and the pair was flat, which is not surprising given the complete absence of fundamental and macroeconomic events, as well as the status of a holiday in the US. The downtrend persists, so nothing has changed for both the pound and the dollar: the latter should continue to rise. There are currently no trend lines or channels due to the weak movement, but we are certain about the downtrend.
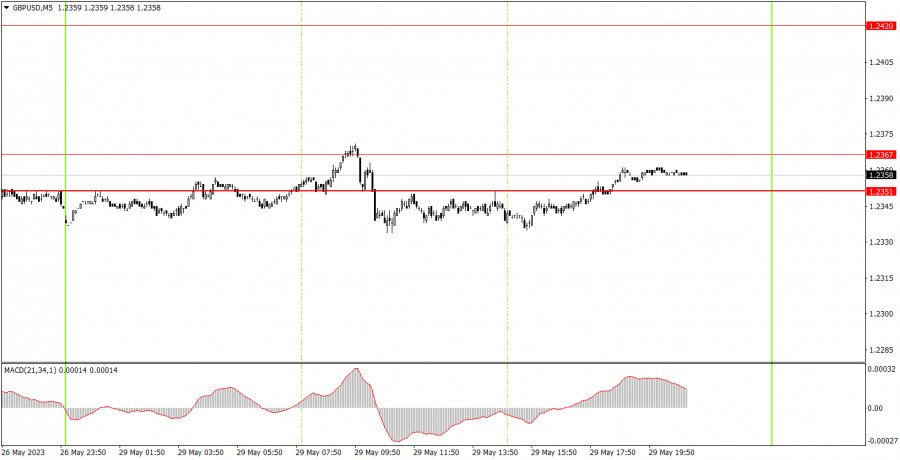
If you tried really hard you could find one signal on the 5-minute chart. At the beginning of the European trading session, the pair technically bounced off the range of 1.2351-1.2367 but failed to move down even by 20 pips, which is not surprising since volatility was just 37 pips. Beginners could have opened a short position using this signal, but by the start of the US session, the pair hardly moved, so the trade could have been closed practically anywhere and you wouldn't gain any profit.
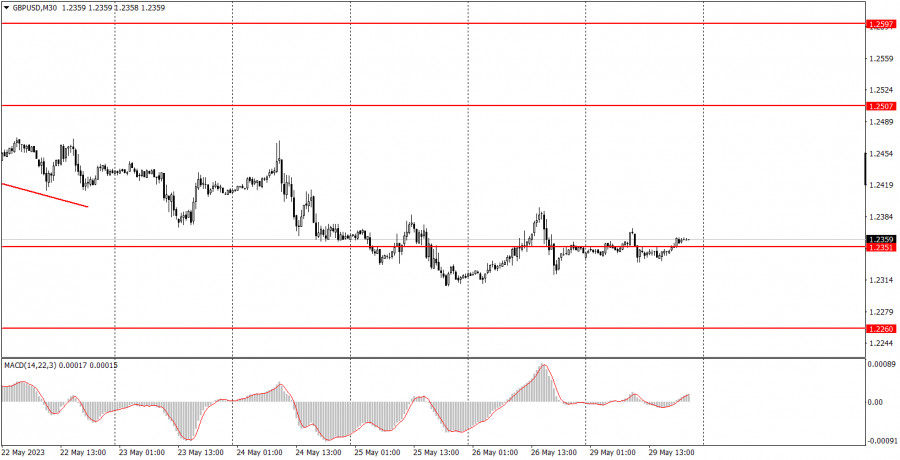
As seen on the 30M chart, the GBP/USD pair continues to trade lower, but in the past few days, we have observed more of a flat with low volatility than any trend-driven movement. We expect the pound to fall further since it hasn't fallen enough yet. The key levels on the 5M chart are 1.2171-1.2179, 1.2245-1.2260, 1.2351-1.2367, 1.2420, 1.2470, 1.2507-1.2520, 1.2597-1.2616. When the price moves 20 pips in the right direction after opening a trade, a stop loss can be set at breakeven. On Tuesday, there are no important events or reports scheduled in the UK or the US. We are in for another completely dull day. Volatility may be low again, and there may be a lack of intraday trending movement.
1) The strength of the signal depends on the time period during which the signal was formed (a rebound or a break). The shorter this period, the stronger the signal.
2) If two or more trades were opened at some level following false signals, i.e. those signals that did not lead the price to Take Profit level or the nearest target levels, then any consequent signals near this level should be ignored.
3) During the flat trend, any currency pair may form a lot of false signals or do not produce any signals at all. In any case, the flat trend is not the best condition for trading.
4) Trades are opened in the time period between the beginning of the European session and until the middle of the American one when all deals should be closed manually.
5) We can pay attention to the MACD signals in the 30M time frame only if there is good volatility and a definite trend confirmed by a trend line or a trend channel.
6) If two key levels are too close to each other (about 5-15 pips), then this is a support or resistance area.
Support and Resistance price levels can serve as targets when buying or selling. You can place Take Profit levels near them.
Red lines are channels or trend lines that display the current trend and show which direction is better to trade.
MACD indicator (14,22,3) is a histogram and a signal line showing when it is better to enter the market when they cross. This indicator is better to be used in combination with trend channels or trend lines.
Important speeches and reports that are always reflected in the economic calendars can greatly influence the movement of a currency pair. Therefore, during such events, it is recommended to trade as carefully as possible or exit the market in order to avoid a sharp price reversal against the previous movement.
Beginners should remember that every trade cannot be profitable. The development of a reliable strategy and money management are the key to success in trading over a long period of time.

QUICK LINKS


 Contact Us

