Stock market analytics, financial forecasts

Forexmart's Market Analysis section provides up-to-date information about the financial market. The overviews are intended to give you an insight into current trends, financial forecasts, global economic reports, and political news that influence the market.

Disclaimer:  Information provided here to retail and professional clients does not contain and should not be construed as containing investment advice or an investment recommendation or an offer or solicitation to engage in any transaction or strategy in financial instruments. Past performance is not a guarantee or prediction of future performance.

Trading Signals for GOLD on November 3-5, 2026: buy above $3,900 or sell below 3,940 (21 SMA - 2/8 Murray)

Conversely, a decisive break above $3,940 could cause gold to face the next resistance level at $3,985; a sharp break above this resistance level could accelerate gold's upward movement
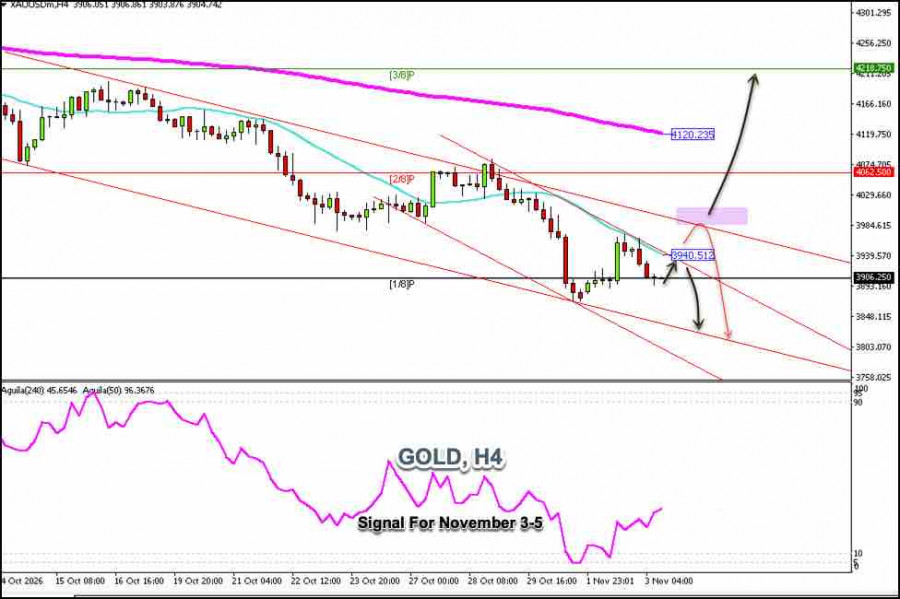
Trading Signals for GOLD on November 3-5, 2026: buy above $3,900 or sell below 3,940 (21 SMA - 2/8 Murray)
13:09 2026-11-03 UTC+00
Exchange Rates analysis

Gold is trading around $3,904, rebounding after having reached the psychological level of $3,900. Strong downward pressure is evident after the price touched the 21-day simple moving average (SMA); furthermore, yesterday, gold reached the upper band of the secondary downtrend channel that has been forming since October 27.

In the coming hours, we could see a technical rebound toward $3,940. However, if downward pressure prevails, this area could be considered an opportunity to open short positions, in anticipation of the gold price closing the gap left at the close of Friday's session.

Technically, we expect gold to resume its downtrend following a pullback toward $3,940, so we will look for opportunities to sell below this zone with targets at $3,870; we would even expect the price to find strong support around the lower band of the downtrend channel, at $3,835.

Conversely, a decisive break above $3,940 could cause gold to face the next resistance level at $3,985; a sharp break above this resistance level could accelerate gold's upward movement and potentially reach the 200-period exponential moving average (EMA) around $4,120.

Given that gold has left a gap, we believe that once this gap is filled, a technical reversal could occur, and gold could recoup some of its losses in the coming days, reaching $4,120 and $4,200.

Feedback

ForexMart is authorized and regulated in various jurisdictions.

(Reg No.23071, IBC 2015) with a registered office at First Floor, SVG Teachers Co-operative Credit Union Limited Uptown Building, Corner of James and Middle Street, Kingstown, Saint Vincent and the Grenadines

Restricted Regions: the United States of America, North Korea, Sudan, Syria and some other regions.


aWS
© 2015-2026 Tradomart SV Ltd.
Top Top
Risk Warning:
Foreign exchange trading carries a high risk of losing money due to leverage and may not be suitable for all investors. Before deciding to invest your money, you should carefully consider all the features associated with Forex, as well as your investment objectives, level of experience, and risk tolerance.