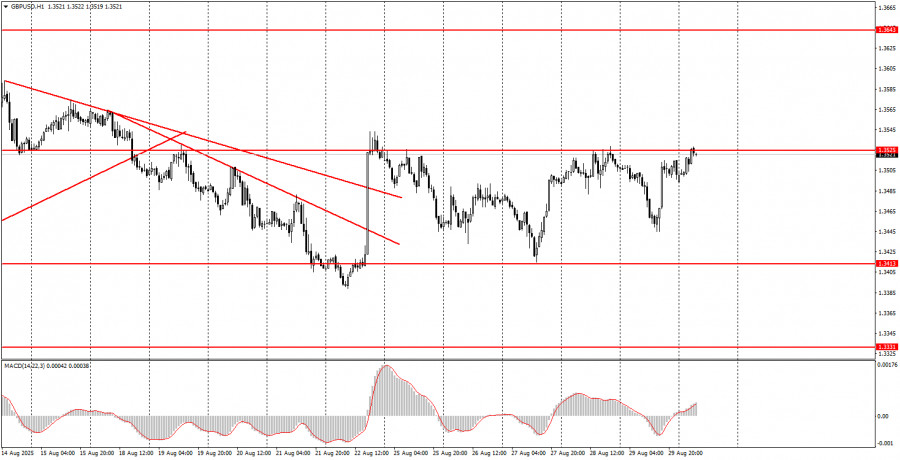
On Friday, the GBP/USD pair traded both lower and higher. The initial decline in the British pound during the first half of the day was not caused by any fundamental or macroeconomic backdrop, but in the second half, the dollar's drop was entirely justified. As expected, the PCE Core Price Index had no impact on trader sentiment; however, the University of Michigan Consumer Sentiment Index came in worse than forecast, which led to a fresh decline in the dollar. Over the past week and a half, we've observed a flat between 1.3413 and 1.3525. Volatility is low, and there is no trend. Thus, to end the flat, the price needs to consolidate above 1.3525. We believe traders will have no problem with this, as the fundamental backdrop remains extremely negative for the dollar. Just last week, the market had several reasons to ramp up new rounds of US dollar selling.
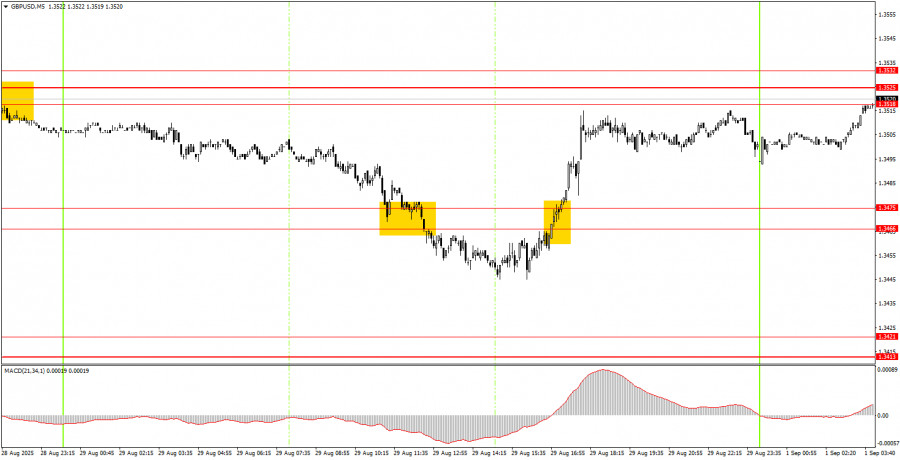
On the 5-minute timeframe on Friday, two trading signals were generated. First, the pair broke below the 1.3466–1.3475 area, but this signal turned out to be false. Then the pair consolidated above this area, and this signal allowed novice traders to make several dozen pips, as the nearest target level was almost reached.
On the hourly timeframe, the GBP/USD pair indicates that the downward trend has ended, and a new upward trend is emerging. The fundamental and macroeconomic backdrop hasn't become any more attractive for the dollar, so we are still only looking upward. Any escalation in the trade war, de-escalation in Ukraine, or pressure from Trump on the Federal Reserve would mean another potential drop for the US currency.
On Monday, the GBP/USD pair may start a new downward wave if the price once again bounces off the 1.3518–1.3532 area. Such a bounce would indicate the flat is continuing. At the same time, breaking through this area is more likely and would allow for opening new long positions with a target of 1.3574–1.3590.
On the 5-minute timeframe, you can currently trade the following levels: 1.3102–1.3107, 1.3203–1.3211, 1.3259, 1.3329–1.3331, 1.3413–1.3421, 1.3466–1.3475, 1.3518–1.3532, 1.3574–1.3590, 1.3643–1.3652, 1.3682, 1.3763.
There are no significant events or reports scheduled for Monday in either the UK or the US; however, several key US reports are expected to be released throughout the week.
Support and Resistance Levels: These are target levels for opening or closing positions and can also serve as points for placing Take Profit orders.
Red Lines: Channels or trendlines indicating the current trend and the preferred direction for trading.
MACD Indicator (14,22,3): A histogram and signal line used as a supplementary source of trading signals.
Important Events and Reports: Found in the economic calendar, these can heavily influence price movements. Exercise caution or exit the market during their release to avoid sharp reversals.
Forex trading beginners should remember that not every trade will be profitable. Developing a clear strategy and practicing proper money management are essential for long-term trading success.

QUICK LINKS


 Contact Us

