The EUR/USD currency pair traded with moderate volatility on Wednesday, but it is still well below its previous levels. Currently, the average daily movement is around 55 pips. This is not a one-off or weekly lull in the market; rather, it is the average over the past month and a half, as shown in the illustration below. The average over the last five days is 58 pips, indicating that above-average volatility is now more the exception than the rule.
Yesterday, the only relatively significant event was the durable goods orders report in the U.S. We warned that this report could provoke volatility, but at the same time, we advised against expecting any lasting impact on trader sentiment. In practice, this turned out to be the case. Immediately after the report's release, the U.S. dollar strengthened sharply (though not substantially), and then the markets stabilized.
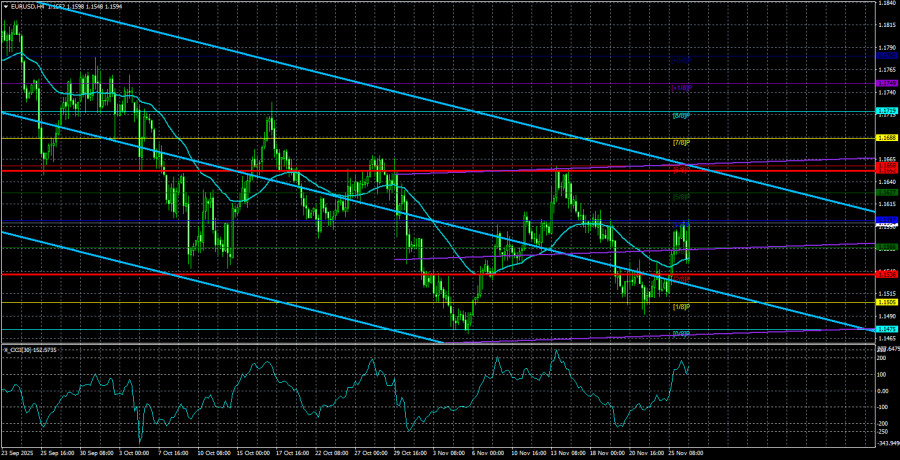
Thus, this report, which showed a reading above expectations, essentially had little impact. It is important to note that the key factor remains the flat pattern on the daily timeframe. We mention this every day, as 80% of the pair's movements depend on this flat. The price has stayed within the sideways channel of 1.1400-1.1830 for over five months. Agreeably, that's quite a long time.
A few days ago, the pair reversed in the area of the lower boundary of this channel for the second time, but since the boundary has not yet been retested, there remains a chance for another drop to the level of 1.1400. Overall, it is the flat that currently explains all market movements and justifies the growth of the American currency. Even over the past month and a half, there have been far more grounds for selling the dollar than for buying it.
However, we've noted numerous times that the flat is not a random occurrence driven by a neutral or frequently changing news flow, which prevents both buyers and sellers from executing their ambitions. The flat is, in essence, a planned phenomenon designed to allow market makers to build positions for future moves and trends.
Thus, the flat could last another year, as it has no specific end date. It can end at any moment, not necessarily following any significant event. It will conclude when the positions of major players are fully established. For obvious reasons, it is impossible to predict when this will happen. Therefore, we must wait and react to potential reversals. As previously mentioned, the 1.1400 area remains a good buying zone for the pair. We still do not believe in a global downward trend; there are no fundamental grounds for the dollar's growth, nor are there any technical indicators of a downward trend on the daily timeframe.
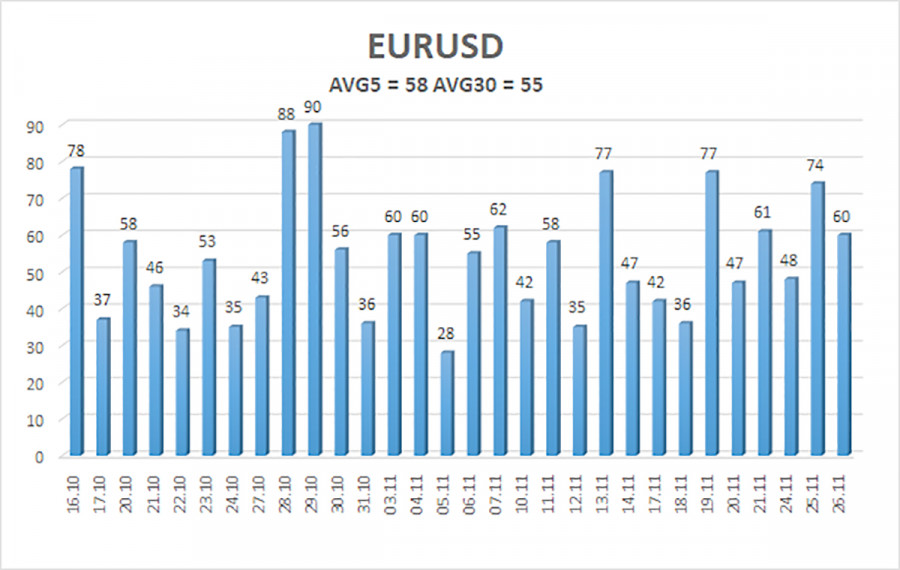
As of November 27, the average volatility of the EUR/USD currency pair over the past five trading days is 58 pips and is considered "average." We expect the pair to trade between 1.1536 and 1.1652 on Thursday. The higher linear regression channel points downward, signaling a downward trend, but in reality, the flat persists on the daily timeframe. The CCI indicator has entered the oversold zone twice in October, which could spark a new upward trend in 2025.
The EUR/USD pair remains below the moving average, but the upward trend persists across all higher timeframes, while the daily timeframe has been flat for several months. The global fundamental background continues to exert a strong influence on the U.S. dollar. Recently, the dollar has been rising, but the reasons for this movement may be purely technical. With the price positioned below the moving average, small short positions targeting 1.1505 can be considered on purely technical grounds. Above the moving average line, long positions remain relevant with a target of 1.1800 (the upper line of the flat on the daily timeframe).

QUICK LINKS


 Contact Us

