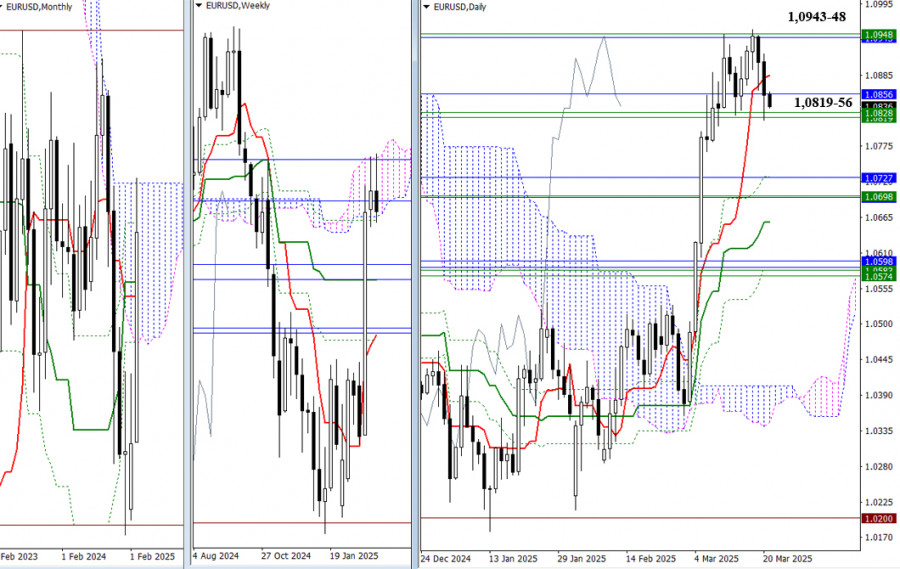
The pair failed to break through the resistance levels of the weekly (1.0948) and monthly (1.0943) Ichimoku clouds, retreating to the support cluster zone across multiple timeframes (1.0819–1.0856). As we wrap up the trading week today, a break and consolidation below this support zone would form a rejection signal on the weekly timeframe. In that case, the bears' next steps would involve confirming and extending the downward movement, with the following support levels in the 1.0696–1.0727 range. If the pair fails to move below 1.0819–1.0856, a pause or consolidation is likely. After that, the market may once again test the Ichimoku cloud boundaries (1.0948–1.0943) in an attempt to break into and stay in bullish territory.
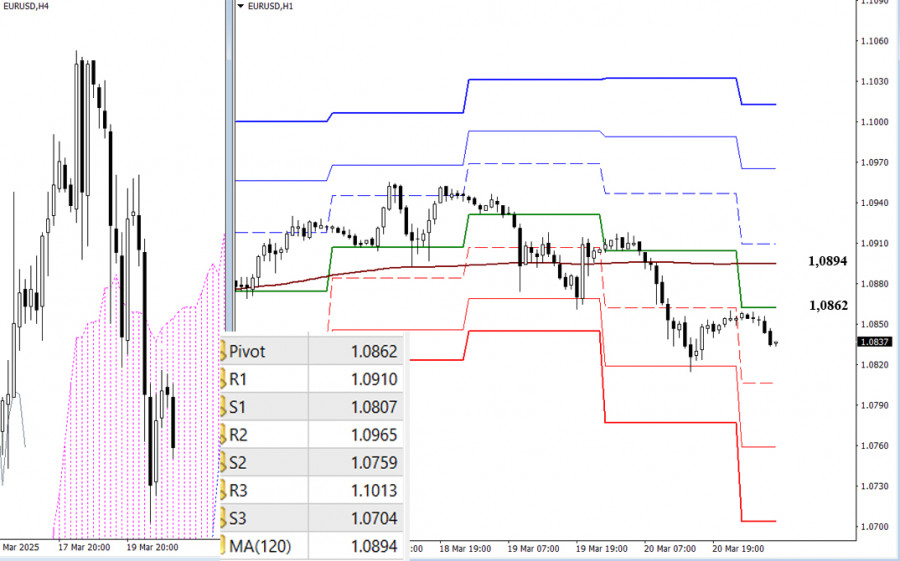
On the lower timeframes, bears have the upper hand. Today's potential for further downside lies through the classic Pivot support levels: 1.0807 – 1.0759 – 1.0704.
Key levels whose breakout could shift the current balance of power are:
If bullish momentum returns, a break above the weekly trend line will reverse its slope. The next upside targets for bulls would be the classic Pivot resistance levels: 1.0910 – 1.0965 – 1.1013.
***
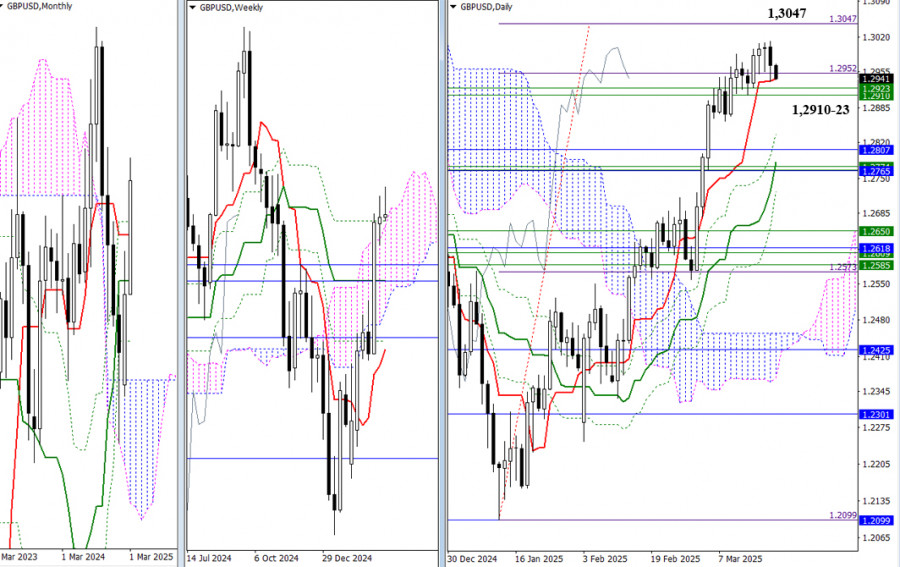
Throughout the current week, bulls managed to update last week's high but achieved no further progress. Instead, they are entering a consolidation phase, using the daily short-term trend line at 1.2941 as support. As a result, previous conclusions and expectations remain valid. The key target for bulls continues to be the 100% Fibonacci projection level at 1.3047, while the nearest bearish plan involves a break below the weekly support levels at 1.2910–1.2923.
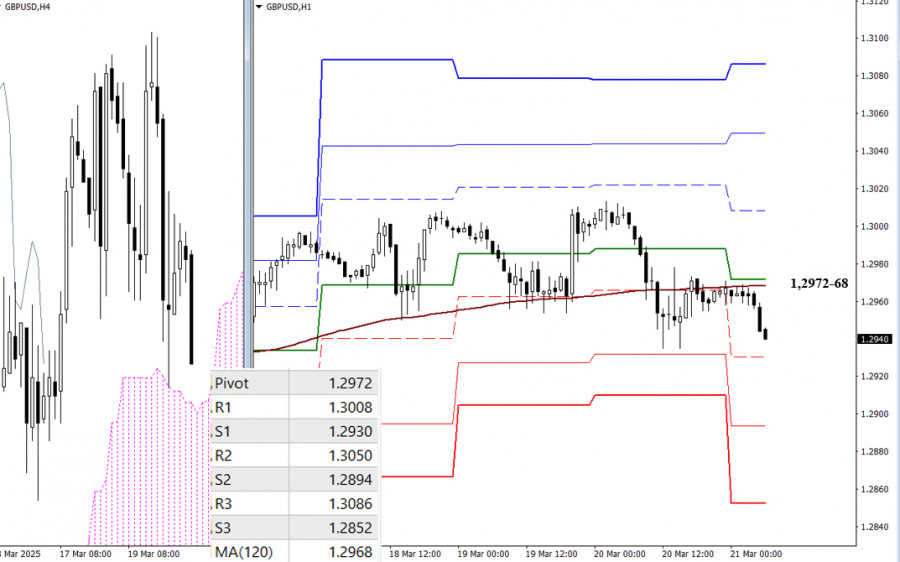
On the lower timeframes, sellers have consolidated below key levels, giving them a technical advantage. To push further downward today, bears will aim to break the classic Pivot supports: 1.2930 – 1.2894 – 1.2852. To reverse the situation, bulls would need to break and hold above the key zone at 1.2972–1.2968 (daily central Pivot + weekly long-term trend), thereby reversing the trend. Continuation of the upward move would require pushing through the Pivot resistance levels: 1.3008 – 1.3050 – 1.3086.
***

ລິ້ງດ່ວນ


 ຕິດຕໍ່ພວກເຮົາ

