Akcie společnosti Kymera Therapeutics Inc (NASDAQ:KYMR) klesly o 5 % poté, co biotechnologická společnost zabývající se klinickým výzkumem oznámila plány na veřejnou nabídku kmenových akcií a předfinancovaných warrantů v hodnotě 250 milionů dolarů.
Společnost se sídlem v Massachusetts, která vyvíjí perorální léky na bázi malých molekul pro imunologická onemocnění, uvedla, že poskytne upisovatelům 30denní opci na nákup akcií v hodnotě až 37,5 milionu dolarů. Nabídka zahrnuje jak kmenové akcie, tak předfinancované opční listy na nákup akcií, přičemž všechny cenné papíry budou prodány společností Kymera.
Kymera uvedla, že výnosy z nabídky budou použity na rozvoj jejích preklinických a klinických programů zaměřených na degradační léky pro velké skupiny pacientů, jakož i na provozní kapitál a obecné firemní účely.
Oznámení přichází v době, kdy společnost pokračuje ve vývoji své platformy proteinových degradačních terapeutik. Společnosti Morgan Stanley, J.P. Morgan, Jefferies, TD Cowen a Leerink Partners působí jako společní manažeři emise.
Společnost upozornila, že navrhovaná nabídka zůstává závislá na tržních a dalších podmínkách a není zaručeno její dokončení ani konečné podmínky.
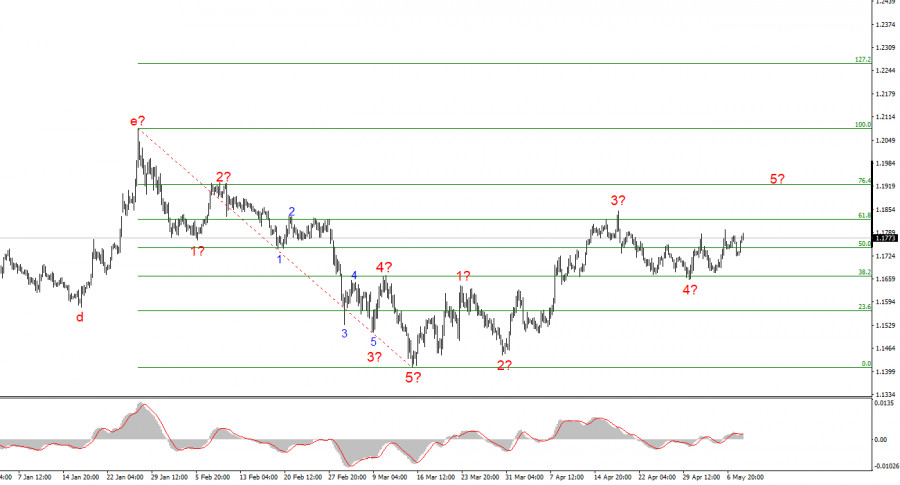
The wave pattern on the 4-hour chart for EUR/USD has changed. There is still no reason to speak about the cancellation of the upward trend segment (lower chart), which began in January of last year, but the trend structure now looks highly ambiguous. In such situations, I always recommend switching to a lower timeframe (upper chart) and analyzing the simplest and smallest wave structures in order to make a short-term forecast, which is usually sufficient for opening trades. Wave structures can be extremely complex and may imply multiple possible scenarios. The easiest approach is to trade standard "five-three" patterns.
In the chart above, I can identify a classic five-wave impulse structure with an extended third wave. After the completion of this structure, the market began forming a corrective sequence consisting of at least three waves. We have already seen three waves, which means the market is likely to form at least one more corrective downward wave in the near future. Further developments will depend on geopolitics: either the upward structure becomes more complex, or a new downward trend segment begins.
The EUR/USD pair rose by 50 basis points on Friday, despite a highly contradictory news backdrop throughout the day.
To begin with, Iran and the United States exchanged missile strikes yesterday, once again casting doubt on future negotiations and the possibility of reaching a peace agreement. However, the following day (today), both Tehran and Washington made official statements confirming that negotiations are continuing and that the latest escalation will not affect them. Consequently, both sides appear committed to resolving the conflict rather than escalating it further, although each side continues responding to what it considers unfair actions by the other.
Apparently, this understanding once again worked against the U.S. dollar and against EUR/USD sellers. Yesterday evening, demand for the dollar increased, but today it declined sharply again.
Today also brought U.S. labor market and unemployment data. Many market participants expected another disappointing Nonfarm Payrolls report, but that did not happen. The number of new nonfarm jobs created in April totaled 115,000, significantly exceeding market expectations of 62,000. The unemployment rate remained unchanged, average wages increased by 3.6% (slightly below forecasts), while the University of Michigan Consumer Sentiment Index came in weaker than expected at 48.2 versus 49.5.
Thus, the consumer sentiment index may have pressured the dollar lower, but few would dispute that Nonfarm Payrolls is far more important. And this report should have supported the U.S. currency.
The conclusion? The market once again ignored economic data in favor of geopolitics.
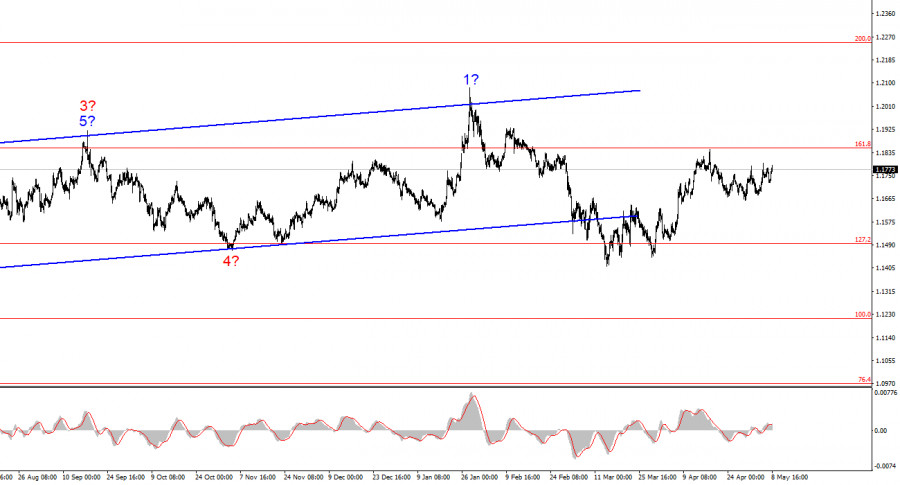
Based on the EUR/USD analysis, I conclude that the instrument remains within a broader upward trend segment (lower chart) and, in the short term, within a corrective structure. The corrective wave sequence appears largely complete and may only become more complex and prolonged if the geopolitical situation in the Middle East continues to improve. Otherwise, a new downward trend segment could begin from current levels.
We have already seen the corrective wave, and I expect the pair to resume its upward movement from current levels, targeting the area around the 1.1900 level.
On the smaller timeframe, the entire upward trend segment is visible. The wave structure is somewhat unconventional, as the corrective waves vary considerably in size. For example, the larger wave 2 is smaller than the internal wave 2 within wave 3. However, such situations do occur. I would also remind traders that it is best to focus on identifying clear and understandable structures on charts rather than attempting to label every single wave. The most recent waves are difficult to identify precisely, which is why my analysis relies more heavily on the higher timeframe.

ລິ້ງດ່ວນ


 ຕິດຕໍ່ພວກເຮົາ

