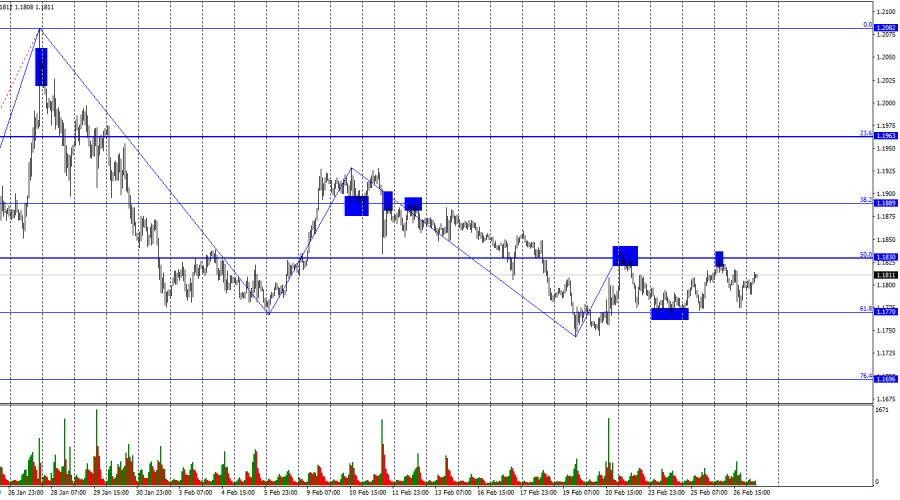
During Thursday, the EUR/USD pair rose to the 50.0% corrective level at 1.1830, rebounded from it, reversed in favor of the U.S. dollar, and declined almost to the 1.1770 level. Today, the pair is moving back toward 1.1830. Thus, another rebound from this level would favor the U.S. dollar and lead to a decline toward 1.1770. A consolidation above 1.1830 would allow traders to expect continued growth toward the next corrective level of 38.2% at 1.1889.
The wave structure on the hourly chart remains straightforward. The last completed downward wave did not break the low of the previous wave, and the new upward wave has not yet broken the previous high. Therefore, the trend remains bearish. Bulls have paused within what had been a large-scale advance, which would not have been possible without Donald Trump, and this pause has become prolonged. However, the effective refusal of the U.S. president to comply with the Supreme Court's decision could bring bullish traders back into the market.
On Thursday, the news background for both the euro and the U.S. dollar was essentially absent, but in the evening the results of negotiations between Iran and the United States in Geneva became known. Tehran and Washington failed to reach an agreement on a nuclear deal, and news agencies reported that no progress had been achieved. Trump is demanding the complete dismantling of Iran's three main nuclear facilities, as well as the transfer of all enriched uranium to the United States. Iran, in turn, refused to move its nuclear fuel outside the country, opposed halting uranium enrichment, rejected the destruction of nuclear facilities, and refused any restrictions on its nuclear program. In fact, this is how the negotiations began, and they appear likely to end in the same position. In my view, Iran used these talks to delay a potential U.S. strike on its territory in order to better prepare for it. Recent reports from Tehran indicate that Iranian forces are preparing for a possible U.S. assault and airstrikes. Against this backdrop, bearish traders resumed selling yesterday.
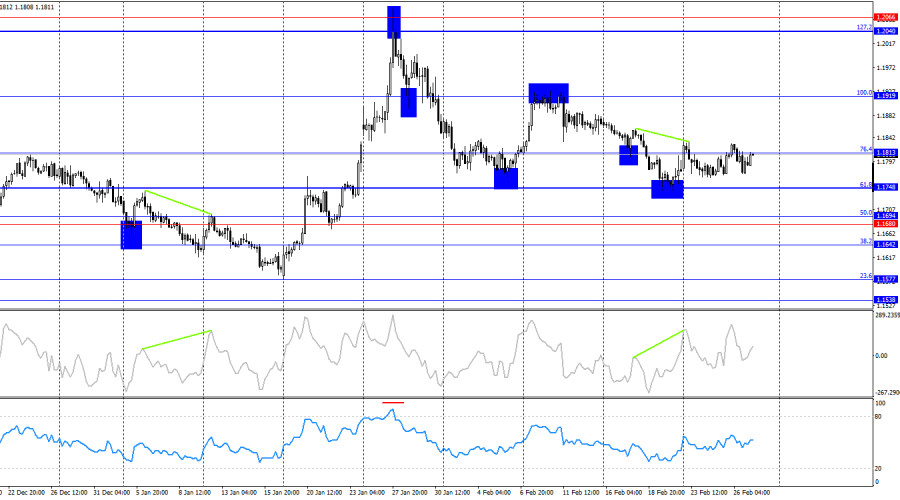
On the 4-hour chart, the pair reversed in favor of the U.S. dollar after a bearish divergence formed on the CCI indicator, but then returned to the 76.4% corrective level at 1.1813. A rebound from this level would push prices back into a downward movement toward the 61.8% Fibonacci level at 1.1748. A consolidation above 1.1813 would increase the probability of further growth toward the 100.0% corrective level at 1.1919. No new emerging divergences are observed on any indicator.
Commitments of Traders (COT) Report:
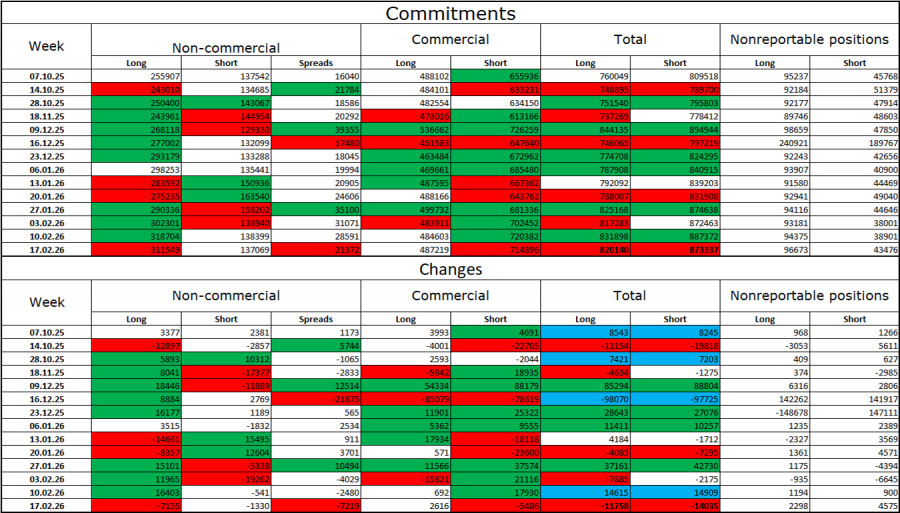
During the last reporting week, professional traders closed 7,155 long positions and 1,330 short positions. The sentiment of the "Non-commercial" group remains bullish due to Donald Trump and his policies and continues to strengthen over time. The total number of long positions held by speculators now stands at 312,000, compared to 137,000 short positions. This represents more than a twofold advantage for the bulls.
For thirty-three consecutive weeks, large players reduced short positions and increased long positions. Then the shutdown began, and now we are observing the same pattern: professional traders continue to build long positions. Donald Trump's policies remain the most significant factor for traders, as they create numerous issues that could have long-term and structural consequences for the United States. These include, for example, a serious deterioration of the labor market (in 2025), a decline in global reputation, and capital outflows from the U.S. Traders are also concerned about the potential loss of Federal Reserve independence in 2026 and Donald Trump's geopolitical ambitions.
News Calendar for the U.S. and the Eurozone:
On February 27, the economic calendar contains four entries, none of which are expected to generate strong market interest. The impact of the news background on market sentiment on Friday may once again be very weak.
EUR/USD Forecast and Trading Tips:
Selling the pair is possible today upon a rebound from the 1.1830 level on the hourly chart, with targets at 1.1770 and 1.1696. Buying is possible upon an hourly close above 1.1830, with targets at 1.1889 and 1.1963.
Fibonacci levels are drawn from 1.1805–1.1578 on the hourly chart and from 1.1919–1.1471 on the 4-hour chart.

QUICK LINKS


 Contact Us

