EUR/USD
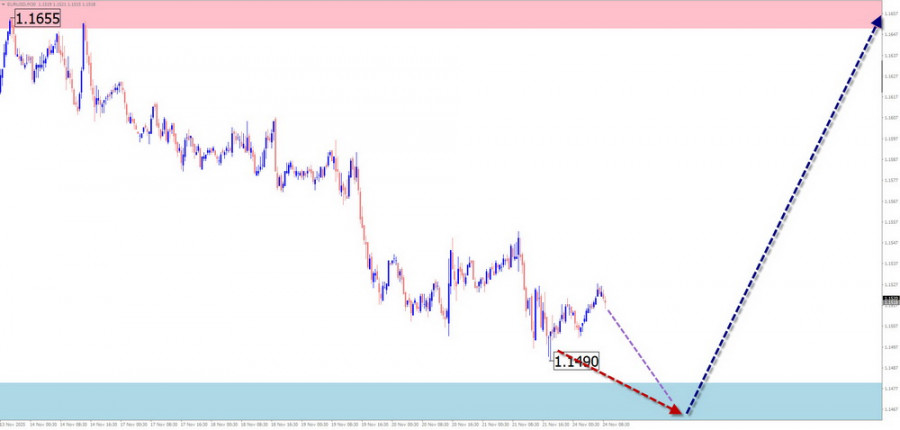
Analysis:The direction of the euro's price movement in its main pair has been set by a downward wave since July of this year. On the daily chart, this section serves as a correction of the previous upward trend. The wave structure is not yet complete. Since September 16, the final part (C) of this wave structure has been developing.
Forecast:At the beginning of the upcoming week, a flat sideways movement is expected. A downward vector is possible. Increased volatility, a reversal, and the start of a price rise toward resistance zones may be expected in the second half of the week. Nearby counter zones will limit the weekly movement of the pair.
Potential Reversal Zones:
Recommendations:
USD/JPY
Analysis: Since mid-summer, the main Japanese yen pair has formed an upward wave on the chart, which is not yet complete. Since November 5, prices have moved in a sideways flat, forming a stretched corrective downward plane. The final part (C) of the wave is missing. Estimated resistance runs along the lower boundary of a potential reversal zone on the daily timeframe.
Forecast: In the next couple of days, the price of the yen is expected to move mainly sideways along the resistance boundaries. A reversal and the beginning of a downward movement are likely afterward. A breakout beyond the calculated zones this week is unlikely.

Potential Reversal Zones:
Recommendations:
GBP/JPY
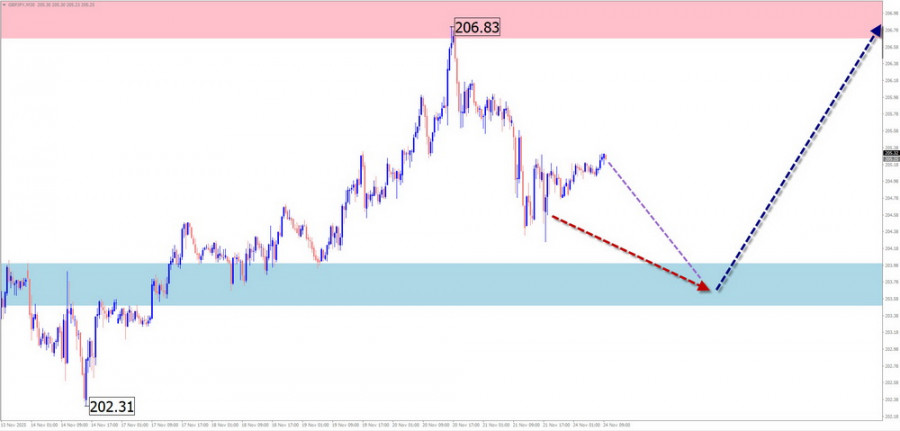
Analysis: The short-term trend of the GBP/JPY pair is defined by an upward wave from August 5. Since August, the price has formed a correction along a strong resistance zone in the form of a stretched/shifting plane. Its structure is incomplete in the middle part (B) at the time of analysis.
Forecast: In the coming days, the downward movement is expected to finish near the support zone. Toward the weekend, a reversal and renewed upward movement toward resistance levels can be expected. A breakout beyond the calculated zones this week is unlikely.
Potential Reversal Zones:
Recommendations:
USD/CAD
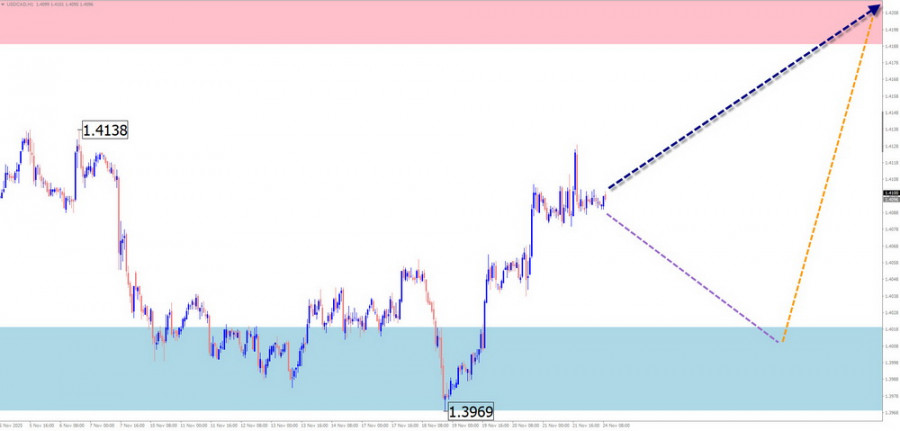
Analysis: The short-term trend of the Canadian dollar has been defined by a bearish wave since February. The wave structure is not complete. Since mid-June, a corrective part of the wave has been forming. Last week, prices broke through intermediate resistance, which became support.
Forecast: At the beginning of the week, a general sideways movement is expected. A decline to the support boundary is possible. By the end of the week, volatility may increase, and the upward direction may resume.
Potential Reversal Zones:
Recommendations:
NZD/USD
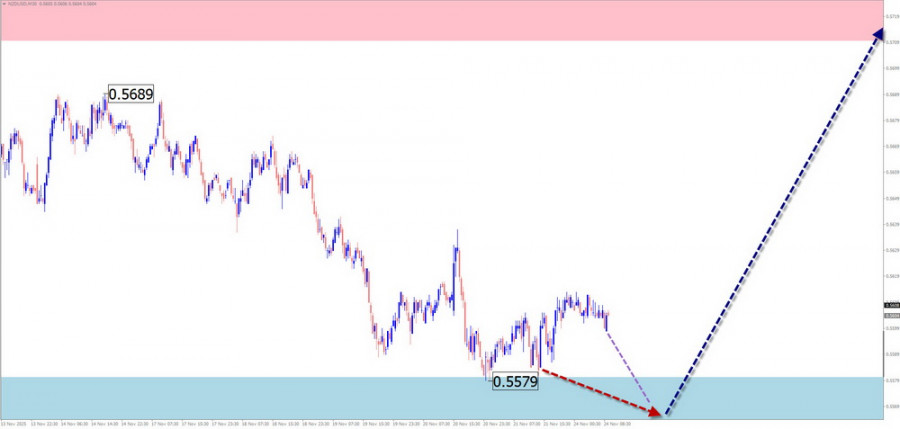
Analysis: Since December of last year, the New Zealand dollar has been moving in a downward wave pattern. Prices reached the upper boundary of a wide daily support zone. The wave structure is near completion. Last week, prices drifted sideways along the support zone.
Weekly Forecast: At the beginning of the week, a continuation of the sideways movement is expected. Pressure on the lower support boundary is possible. A reversal and price increase may be expected later, with a higher probability in the second half of the week. Peak activity is likely around major economic news releases.
Potential Reversal Zones:
Recommendations:
EUR/GBP
Analysis: An incomplete section of the dominant downward trend of the EUR/GBP pair has been developing since September 26. Prices have reached the upper to lower boundary of a wide potential reversal zone on the weekly timeframe. An intermediate correction is developing, not yet complete.
Weekly Forecast: In the first half of the week, sideways movement with an upward vector is expected. Price growth is likely to remain below resistance boundaries. A resumption of the bearish trend is likely afterward. Calculated support defines the lower boundary of the expected weekly range.

Potential Reversal Zones:
Recommendations:
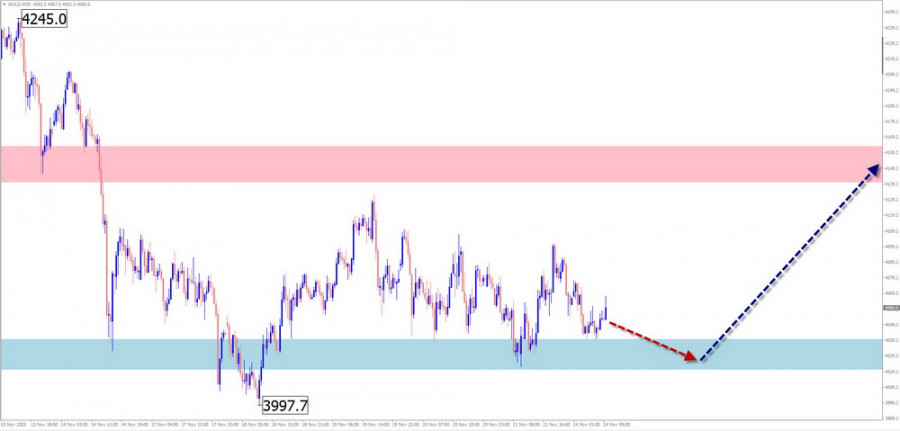
GOLD
Analysis: Since mid-October, the short-term price movement of gold has been defined by a downward wave. On the daily chart, this wave corrects the last section of the dominant trend. The correction structure is incomplete. Prices form a horizontal pennant.
Forecast: Flat price movement may continue for the next few days. Pressure on the support zone, even a brief breach, is possible. Afterward, sideways drift may occur, creating conditions for the resumption of upward movement. Increased volatility and a trend reversal are likely closer to the weekend.
Potential Reversal Zones:
Recommendations:
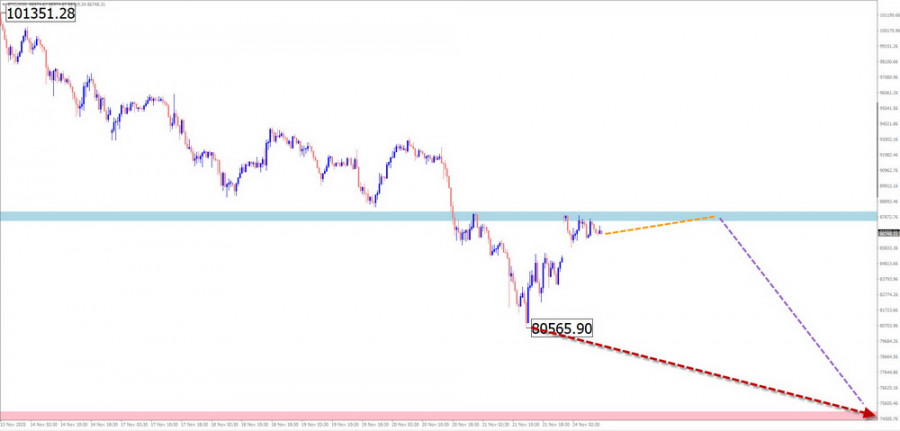
#Bitcoin
Analysis: Since November of last year, Bitcoin has been forming a downward corrective wave in the form of a stretched flat. Its structure is incomplete, with the final part (C) developing. The target zone lies within a strong potential reversal area on a larger scale.
Forecast: In the next couple of days, sideways movement is most likely. A brief retracement toward calculated resistance zones is possible. Closer to the weekend, a trend reversal and renewed decline may occur, toward the support zone.
Potential Reversal Zones:
Recommendations:
Notes: In simplified wave analysis (SWA), all waves consist of 3 parts (A-B-C). At each timeframe, the last incomplete wave is analyzed. Expected movements are shown with dotted lines.
Attention: The wave algorithm does not take into account the duration of price movements over time.

PAUTAN SEGERA


 Hubungi Kami