Společnost FatPipe, Inc., průkopník v oblasti softwarově definovaných rozsáhlých sítí („SD-WAN“) pro podniky, poskytovatele komunikačních služeb, poskytovatele bezpečnostních služeb, vládní organizace a střední podniky, s potěšením oznamuje stanovení ceny své upsané primární veřejné nabídky 695 656 kmenových akcií za cenu jedné akcie. Kmenové akcie byly schváleny ke kotaci na kapitálovém trhu Nasdaq a očekává se, že se s nimi začne obchodovat dne , pod symbolem „FATN“.
Společnost očekává, že z nabídky získá celkový hrubý výnos před odečtením upisovacích slev a dalších souvisejících nákladů. Kromě toho Společnost poskytla upisovatelům 45denní opci na nadměrné přidělení, na základě které mohou nakoupit až 104 348 kusů kmenových akcií za cenu veřejné nabídky sníženou o upisovací slevy. Očekává se, že primární veřejná nabídka bude uzavřena přibližně dne , pokud budou splněny obvyklé podmínky uzavření.
D. Společnost Boral Capital LLC působí jako jediný vedoucí manažer nabídky.
Společnost Sichenzia Ross Ference Carmel LLP, , působí jako právní poradce společnosti a společnost Lucosky Brookman LLP, , působí jako právní poradce upisovatele v souvislosti s nabídkou.
The EUR/USD pair continued to decline on Tuesday, even though there was no fundamental justification for the dollar's growth. It was reported that Donald Trump decided to raise tariffs not only against Japan and South Korea but also against several other countries. While none of these nations are major economies—and the market barely reacted to tariffs on countries like Serbia or Tunisia—it still marked another step in the escalation of the trade war. Meanwhile, only three trade deals have been signed so far out of a much larger total. Therefore, a renewed drop in the dollar would have been more logical.
There were no macroeconomic events on Tuesday, so reports could not have triggered the dollar's strengthening either. It should be noted that the dollar once again appreciated only slightly and continues to show signs of consolidation. The downward channel has a very shallow slope, and the price is adhering closely to its boundaries. A decline toward the Senkou Span B line is currently possible, but the strength of the dollar's growth, its movement pattern, and the fundamental backdrop point to one conclusion: the upward trend is likely to resume.
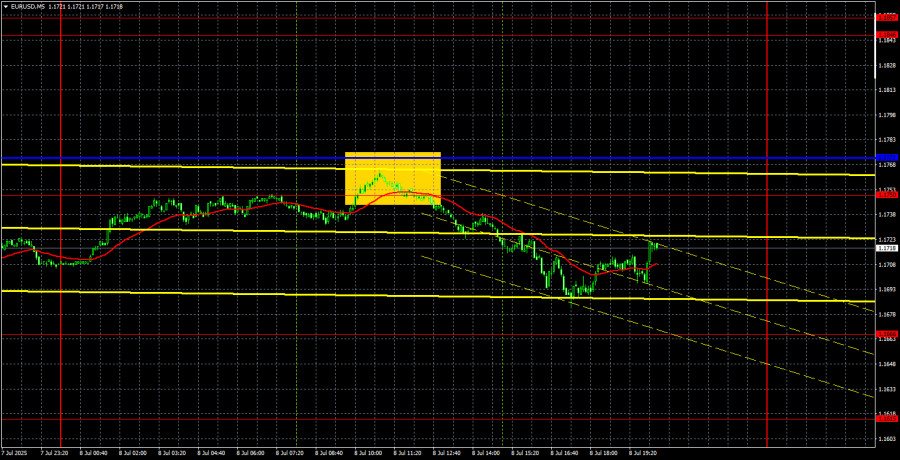
Only one trading signal formed yesterday. During the European session, the price rebounded from the 1.1750–1.1772 area (Kijun-sen line) and resumed its downward movement. Traders could have opened short positions with a target of 1.1666. The price did not reach this target level, but traders had time to close the trade manually in profit.
The latest COT report is dated July 1. As shown in the chart above, the net position of non-commercial traders had been bullish for a long time. Bears only managed to briefly gain the upper hand at the end of 2024, but quickly lost it again. Since Trump took office, only the dollar has been falling. We cannot say with absolute certainty that the decline of the U.S. dollar will continue, but current global developments suggest this scenario is plausible.
We still do not see any strong fundamental factors supporting the euro, but there remains one significant factor driving down the dollar. The global downward trend is still in place, although at this point, past 16-year movements are less relevant. Once Trump ends his trade wars, the dollar could begin to rise—but will he end them, and when?
At the moment, the red and blue lines have crossed again, meaning the market trend remains bullish. During the last reporting week, the number of long positions in the "Non-commercial" group increased by 1,200, while short positions rose by 4,800. As a result, the net position decreased by 3,600.
EUR/USD 1H Chart Analysis
On the hourly timeframe, the EUR/USD pair continues its downward movement within a descending channel. This means the dollar may continue to rise erratically for a couple more days, but its medium-term outlook appears bleak. The steady flow of news from the U.S. continues to signal to traders that they should avoid the dollar. Even strong macroeconomic data has not helped. Donald Trump's policies are undermining the dollar's global reserve currency status. This week, he announced new tariffs for a number of countries, so the dollar's current growth looks like either a temporary technical correction—or an anomaly.
Key Trading Levels for July 9:
Note: Ichimoku indicator lines may shift during the day, and this should be considered when identifying trading signals. Don't forget to place a breakeven Stop Loss order once the price moves 15 points in the correct direction to protect against potential false signals.
No major events or publications are scheduled for Wednesday in either the EU or the U.S. Therefore, trading will likely remain within the descending channel. In the evening, the U.S. will release the minutes from the latest FOMC meeting, but this document is largely formal and usually does not contain any information relevant to traders.
Explanations to the illustrations:

فوری رابطے


 ہم سے رابطہ کریں

