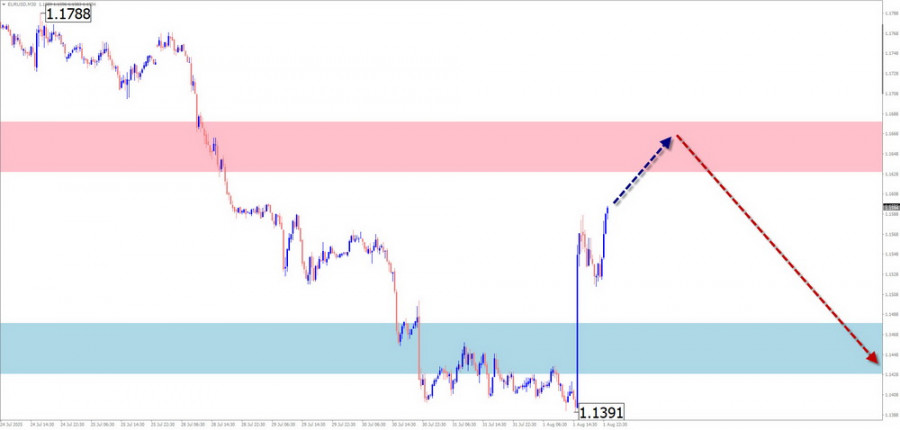
EUR/USD
Analysis: The euro's price movement is guided by an upward wave that began in December last year. Over the past two months, a corrective segment has developed within this structure, forming an extended flat pattern. The upward part from July 30 shows reversal potential and may signal the beginning of the wave's final phase if confirmed.
Forecast: Continued upward movement is expected. After likely pressure on the resistance zone, a reversal toward the support zone is possible. The anticipated weekly range lies between the nearest reversal zones.
Potential Reversal Zones
Recommendations:
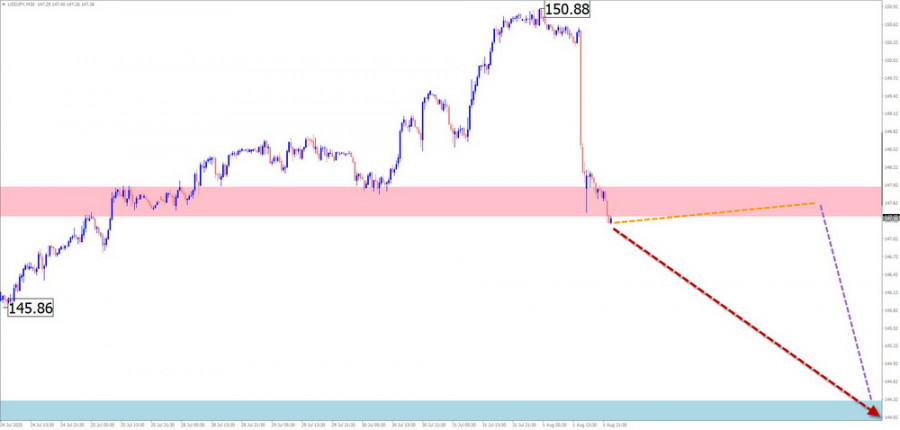
USD/JPY
Analysis: The short-term uptrend that started in late April appears complete. The price has reached a strong potential reversal zone. A downward part began last Friday with reversal potential. If confirmed, it may initiate a new trend.
Forecast: A generally bearish move is expected this week. In the early days, the price may stall near resistance and possibly test its upper boundary. A reversal is likely to follow, with the lower boundary shown by the support zone.
Potential Reversal Zones
Recommendations:
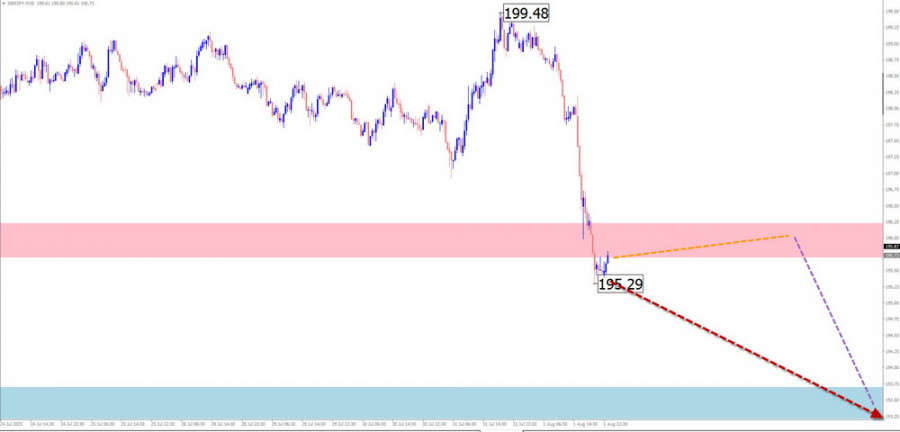
GBP/JPY
Analysis: The British pound has shown stable growth against the yen in recent months. Since mid-July, a corrective segment has been forming near a strong resistance boundary. The final part of this wave model began late last week. No signs of an imminent reversal are visible on the chart.
Forecast: A mostly sideways movement near the resistance zone is expected at the start of the week, possibly testing the zone's upper limit. Later in the week, a downward reversal toward the support zone is likely.
Potential Reversal Zones
Recommendations:
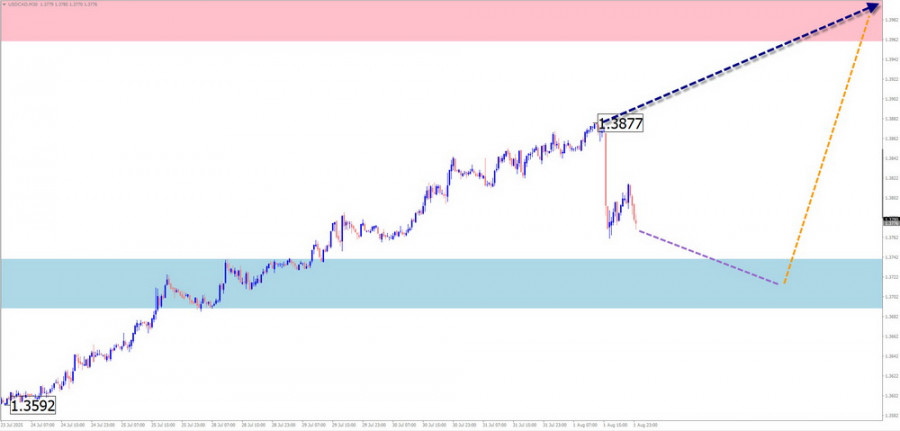
USD/CAD
Analysis: Since February, a downward wave has been developing. Within it, a corrective upward move has formed since late May as an extended flat pattern. The incomplete upward segment started on July 23 and lacks its final part.
Forecast: The upward bias is expected to continue throughout the week until the wave completes near resistance. A downward pullback toward the support zone is possible early in the week, with a reversal and renewed upward movement more likely toward the weekend.
Potential Reversal Zones
Recommendations:
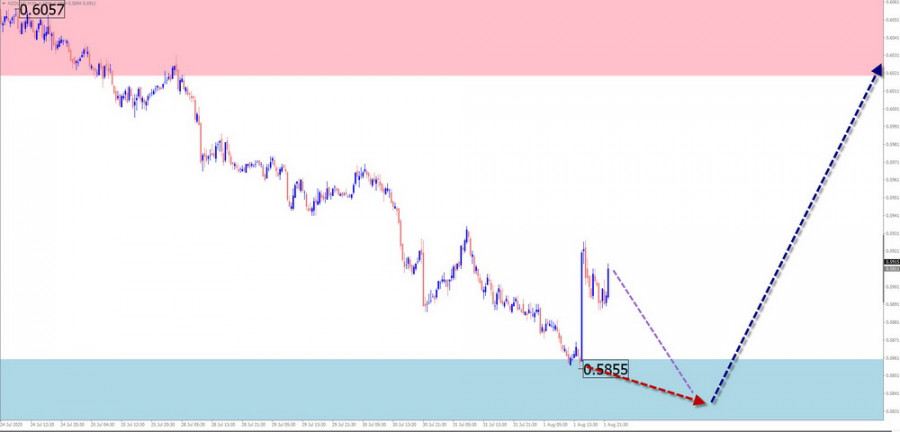
NZD/USD
Brief Analysis: Since April, NZD/USD has been moving in an upward trend. The current corrective wave is still incomplete and resembles an extended flat pattern nearing its end. The pair has reached a strong support zone from which a counter-trend move has begun.
Weekly Forecast: A sideways movement with a bearish bias is expected early in the week, potentially testing the lower support boundary. Later, a reversal and price growth are likely.
Potential Reversal Zones
Recommendations:
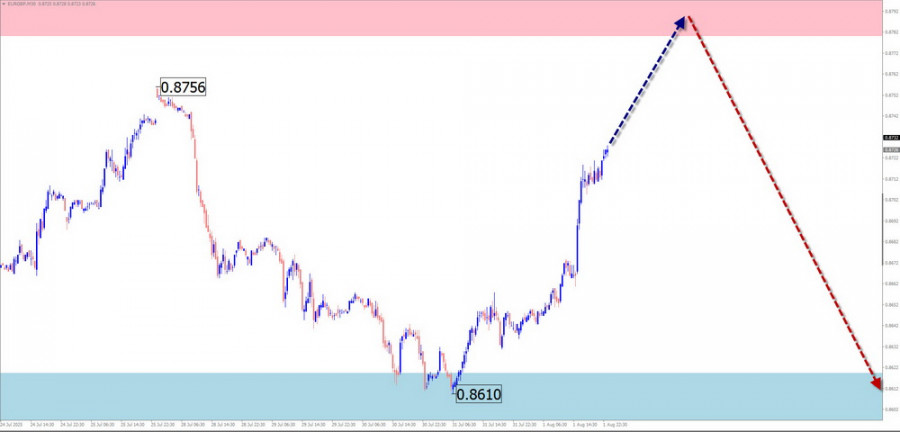
EUR/GBP
Brief Analysis: The long-term downward wave that began three years ago continues to move sideways. The structure of wave (B) appears to be nearing completion. The corrective pattern is close to its end, and price is approaching the lower boundary of the current target zone.
Weekly Forecast: An upward bias is likely early in the week. After contact with the resistance zone, sideways movement may follow. Toward the weekend, the likelihood of renewed downward movement increases.
Potential Reversal Zones
Recommendations:
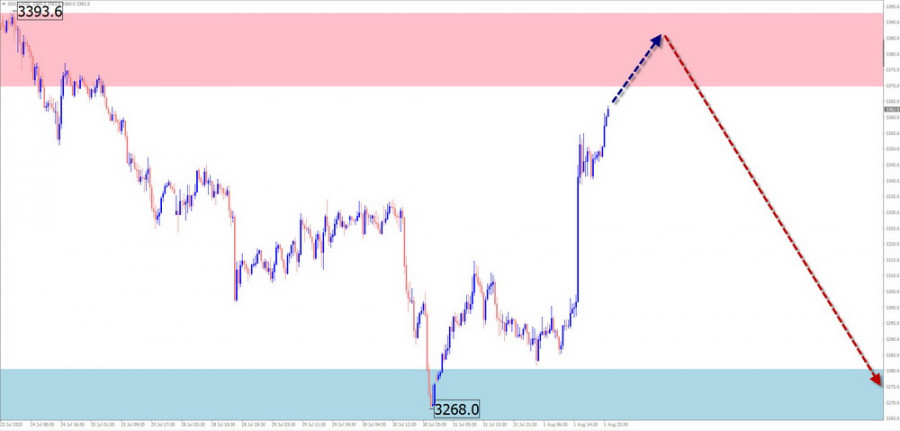
Gold
Analysis: The ongoing downward wave structure in gold began in mid-April. Chart extremes form a "horizontal pennant" pattern. The wave still lacks its final part. The lower boundary of the resistance zone in the weekly time frame coincides with the calculated resistance level.
Forecast: Renewed pressure on resistance is expected early in the week. This may be followed by a reversal and decline toward the support zone.
Potential Reversal Zones
Recommendations:
Note: In simplified wave analysis (SWA), all waves consist of three parts (A-B-C). Only the last, incomplete wave is analyzed on each time frame. Dotted lines show expected price movements.
Important: The wave algorithm does not account for the duration of price movements over time.

فوری رابطے


 ہم سے رابطہ کریں

