Tencent Holdings, největší čínská technologická společnost podle tržní kapitalizace, ve středu oznámila 13% nárůst tržeb za první čtvrtletí, který byl tažen růstem v segmentu her.
Tencent, který je také největším světovým výrobcem videoher a provozovatelem komunikační platformy WeChat, vykázal za čtvrtletí končící 31. březnem tržby ve výši 180 miliard juanů (24,97 miliardy USD).
Výsledky překonaly průměrný odhad analytiků oslovených agenturou LSEG, který činil 174,6 miliardy juanů.
Čistý zisk za čtvrtletí činil 47,8 miliardy juanů, zatímco analytici podle údajů LSEG očekávali 52,2 miliardy juanů.
Růst tržeb byl primárně tažen silným výkonem herního segmentu, který těžil z uvolnění regulace v čínském herním sektoru po přísných omezeních v předchozích letech.
Za čtvrtletí vzrostly tržby z domácího hazardu o 24 % na 42,9 miliardy juanů, zatímco tržby z mezinárodního hazardu vzrostly o 23 % na 16,6 miliardy juanů.
Mezi klíčové tituly, které poháněly růst, patřila hra „Dungeon & Fighter Mobile“ uvedená na trh v květnu 2024 a střílečka „Delta Force“, která debutovala v září.
The EUR/USD currency pair traded higher throughout Thursday, which seemed fantastic. Remember that in recent weeks, the European currency had been falling while the dollar was rising for absolutely any reason. Even when there were no reasons, the pair's downward movement continued. Thus, the pair's baseless rise on Thursday was surprising. However, we must remember that fundamentally, the pair should rise and only rise. We consider the entire October decline illogical and purely technical—there is a flat range on the daily timeframe, which is why the decline moved from the upper to the lower boundary.
Yesterday, two of the less significant reports were published in the European Union, each showing weaker values than forecasted. Industrial production in Germany increased by only 1.3% month-on-month against forecasts of +3%, while retail sales in the EU fell by 0.1% against forecasts of +0.2%. Thus, it would have been quite logical for the euro currency to decline on Thursday. But once again, we saw a completely illogical market reaction to macroeconomic data, and even the Bank of England meeting offered no explanations, as its results turned out to be more "dovish" than expected. Meanwhile, the British pound rose.
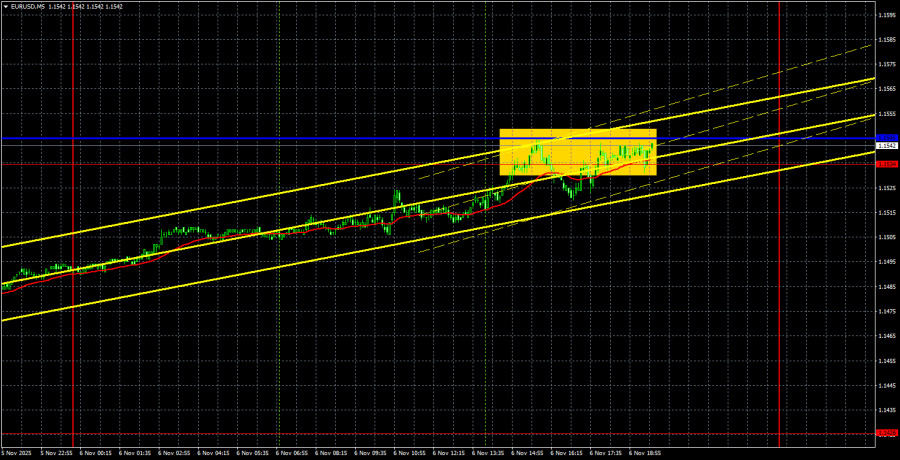
On the 5-minute timeframe, the first trade signal was formed only by the end of the day. The pair reached the 1.1534-1.1545 area and bounced off it. We still believe that the global upward trend will resume, so under the current circumstances, where the probability of completing the local downward trend is high, we would delay sales.
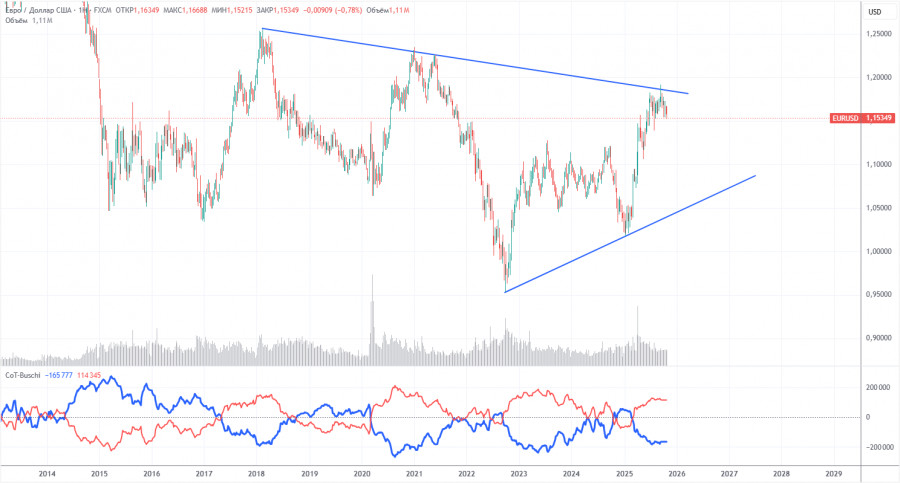
The latest COT report is dated September 23. Since then, no further COT reports have been published due to the US "shutdown". The illustration above clearly shows that the net position of non-commercial traders had been "bullish" for a long time; the bears only briefly entered the zone of their own superiority at the end of 2024 but quickly lost it. Since Trump began his second term as President of the USA, the dollar has only been falling. We cannot say that the decline of the American currency will continue with 100% probability, but current developments around the world suggest this scenario.
We still do not see any fundamental factors that would strengthen the European currency, while there are still enough factors that would lead to the decline of the American dollar. The global downward trend persists, but how important is it now that the price has moved over the past 17 years? Once Trump concludes his trade wars, the dollar may begin to rise, but recent events indicate that the war will continue in one form or another for a long time.
The positioning of the red and blue lines of the indicator continues to indicate the preservation of the "bullish" trend. During the last reporting week, the number of longs for the "Non-commercial" group decreased by 800, while the number of shorts increased by 2,600. Consequently, the net position decreased by 3,400 contracts over the week. But this data is already outdated and has no significance.
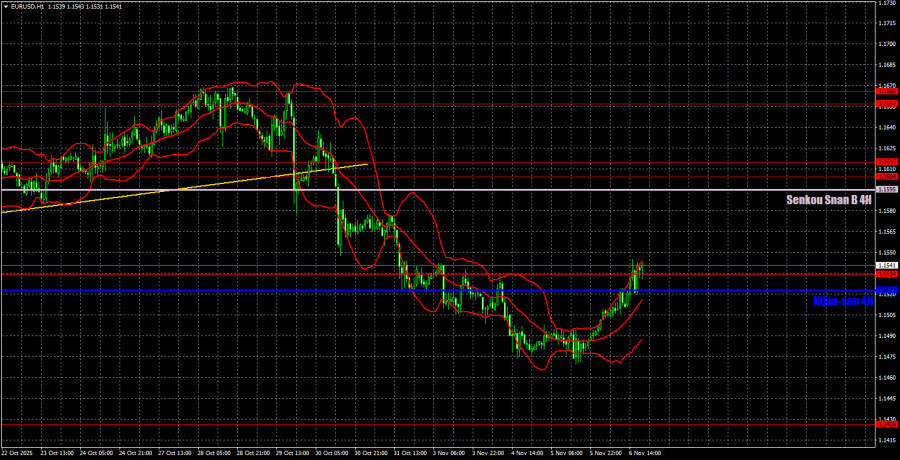
On the hourly timeframe, the EUR/USD pair continues to form another downward trend. Recently, the European currency has only fallen, and it is still extremely difficult to find explanations for this that are not from the realm of science fiction. We believe the main reason for the inadequate and illogical movements is the flat on the daily timeframe, which remains intact. As the price approaches the lower boundary of the side channel, we can expect the decline on the hourly timeframe to conclude soon.
For November 7, we identify the following levels for trading: 1.1234, 1.1274, 1.1362, 1.1426, 1.1534, 1.1604-1.1615, 1.1657-1.1666, 1.1750-1.1760, 1.1846-1.1857, 1.1922, 1.1971-1.1988, as well as the Senkou Span B line (1.1595) and Kijun-sen (1.1523). The Ichimoku indicator lines may move throughout the day, which should be taken into account when determining trade signals. We do not forget to set Stop Loss orders at breakeven if the price moves in the right direction by 15 pips. This will protect against potential losses if the signal turns out to be false.
No significant events are scheduled in the EU on Friday, and in the USA, instead of Non-Farm Payrolls and the unemployment rate, the University of Michigan consumer sentiment index will be published. If the decline within the flat has ended, the pair will continue to rise even without corresponding macroeconomic data.
On Friday, traders can expect a continuation of the rise if the 1.1523-1.1545 area is surpassed. And everything is heading in this direction. In this case, the European currency will continue its logical rise, targeting the Senkou Span B line at 1.1595.

فوری رابطے


 ہم سے رابطہ کریں

