Podle údajů lodních dopravců a tří obchodních zdrojů dodali obchodníci v červnu do Evropy nejvíce leteckého paliva za téměř rok, protože nižší přepravní sazby a dostatek asijských zásob podpořily vývoz, a to navzdory obavám z přerušení dodávek z Blízkého východu.
Podle údajů společnosti Kpler směřuje do Evropy z Jižní Koreje a Číny přibližně 350 000 tun (2,8 milionu barelů) leteckého paliva, přičemž někteří obchodníci odhadují objem objednávek v červnu na 465 000 tun.
Analytici očekávají, že tyto dodávky mírně zmírní nadbytek leteckého paliva v Asii a v blízké budoucnosti zajistí minimální ceny.
Podle údajů si pět tankerů, které byly naloženy v červnu, pronajaly společnosti Vitol, BP, Aramco Trading, Gunvor a Unipec, obchodní divize největší asijské rafinérie Sinopec.
The EUR/USD currency pair continued to trade between a series of levels, areas, and lines on Tuesday. Overall, there is little point in analyzing which levels were breached and which were not. Sideways movement with a minimal upward slope and low volatility is evident. Currently, the euro is trading against the dollar between the Senkou Span B line and the 1.1615-1.1625 area. Essentially, the movements observed daily are market noise rather than reactions to events. The macroeconomic backdrop remains largely ignored, and the market is clearly fatigued by geopolitical issues.
On Tuesday, the EU released the May inflation report, significantly raising the chances of the European Central Bank tightening monetary policy in June, despite the forecasts aligning with the actual value. The market also paid no attention to Trump's new promises of a forthcoming peace agreement with Iran.
From a technical standpoint, the downward trend remains, as the pair still cannot break above the Senkou Span B line. For almost three weeks, we have witnessed a sideways movement following a strong decline, which best indicates the weakness of the bulls and a lack of geopolitical growth factors. However, bears are also hesitant to open new positions, as geopolitical uncertainty remains high.
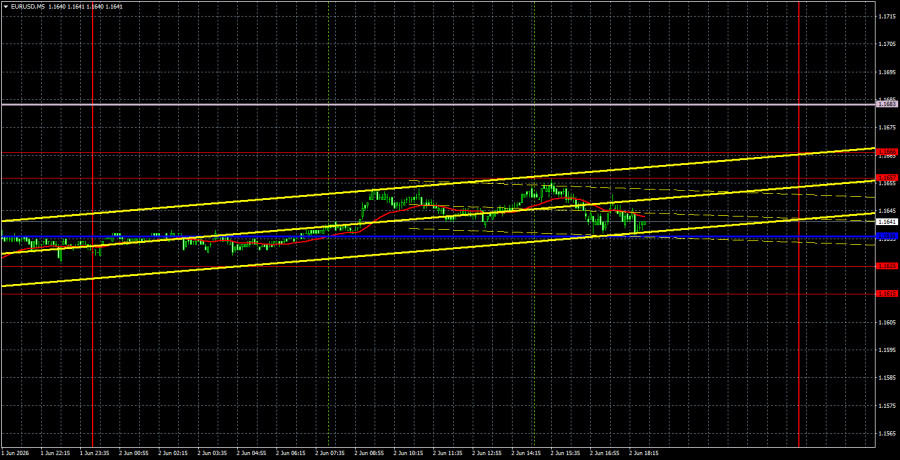
On the 5-minute timeframe on Tuesday, the price spent all day between the Kijun-sen line and the 1.1657-1.1666 area. Searching for signals in this area and opening positions made little sense, as the nearest targets were out of reach.
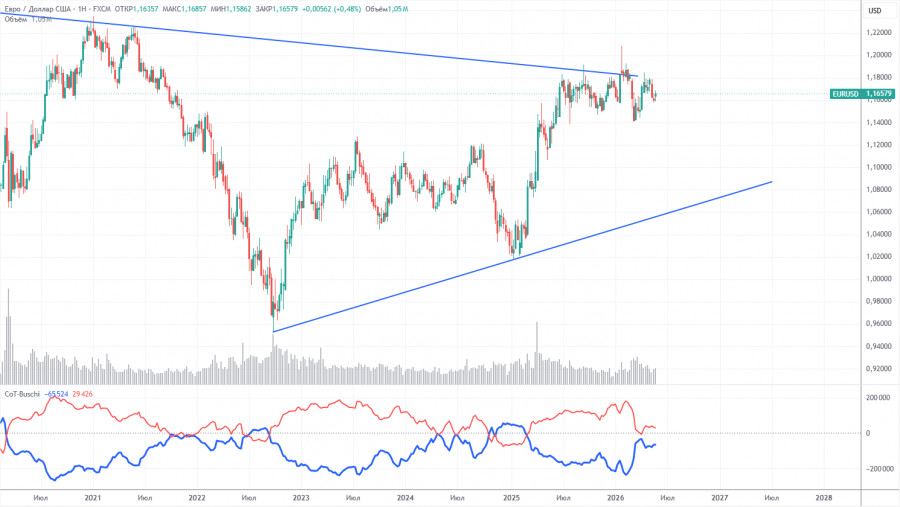
The latest COT report is dated May 26. The weekly timeframe illustration clearly shows that the net position of non-commercial traders remains "bullish," but is rapidly decreasing due to geopolitical events. Traders have been shedding the European currency in favor of the US dollar in recent months. Trump's policies have not changed, but for a time, the dollar was a "reserve currency." However, this process may already be complete.
We still see no fundamental factors for the strengthening of the euro, while there are sufficient factors for the decline of the dollar. The war in the Middle East made the dollar temporarily super attractive, but when this factor expires, everything will revert to normal. In the long term, the euro may drop as low as 1.06 (the trend line), but the upward trend will still remain relevant. Currently, the pair has not deviated significantly from the descending trend line, which has been broken several times.
The positioning of the red and blue lines in the indicator indicates parity between bulls and bears. Over the last reporting week, the number of longs in the Non-Commercial group decreased by 10,200, while the number of shorts decreased by 6,100. Accordingly, the net position fell by 4,100 contracts over the week.
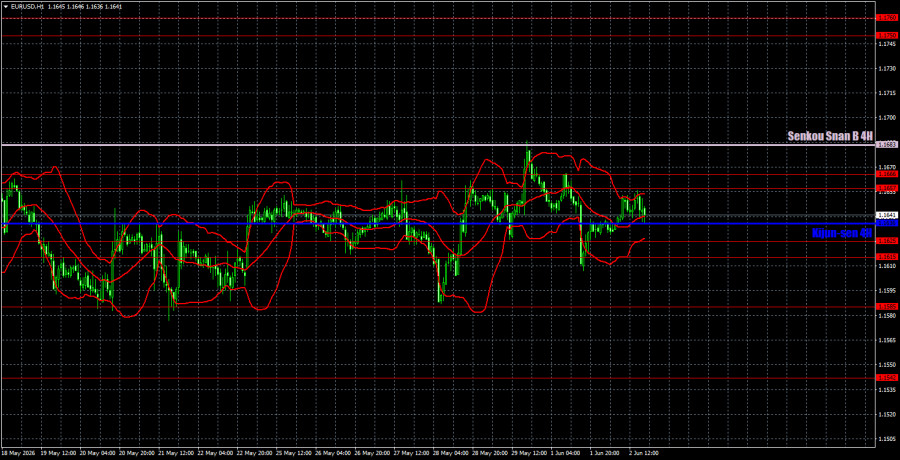
On the hourly timeframe, the EUR/USD pair continues to form a downward trend and remains generally flat. The situation in the Middle East remains tense, not worsening, and Washington and Tehran are likely only dreaming of signing a preliminary agreement. If no new signs of a resumption of war in the Middle East emerge and the memorandum is truly signed, the dollar may begin to lose ground. But for now, we are observing neither of these scenarios.
For June 3, we highlight the following levels for trading: 1.1362, 1.1426, 1.1542, 1.1585, 1.1615-1.1625, 1.1657-1.1666, 1.1750-1.1760, 1.1786, 1.1830-1.1837, 1.1907-1.1922, as well as the Senkou Span B line (1.1683) and Kijun-sen line (1.1636). The lines of the Ichimoku indicator may shift throughout the day, which should be taken into account when determining trading signals. Don't forget to set a Stop Loss order to break even if the price moves in the correct direction by 15 pips. This will protect against potential losses if the signal turns out to be false.
On Wednesday, only minor data will be published in the Eurozone, while the US will release relatively important ADP employment and ISM services activity reports. However, given the market's current reaction to significant reports, as observed on Monday and Tuesday, significant movements are not anticipated.
Today, traders may open short positions targeting 1.1585 and 1.1542 if the price consolidates below the 1.1615-1.1625 area. Long positions can be opened on a bounce from the 1.1615-1.1625 area, targeting the 1.1657-1.1666 area and the Senkou Span B line.

فوری رابطے


 ہم سے رابطہ کریں

