Analiza rynku

Przeglądy analityczne ForexMart dostarczają aktualnych informacji na temat rynku finansowego. Przeglądy te zawierają informacje o trendach rynkowych, prognozach finansowych, raportach ekonomicznych i wiadomościach politycznych, które mają wpływ na rynek.

Disclaimer:  ForexMart nie udziela rekomendacji inwestycyjnych, a dostarczone materiały analityczne nie gwarantują przyszłych wyników.

Trading Signals for ETH/USD on May 13-15, 2026: sell below $2,300 or buy above $2,250 (21 SMA - 2/8 Murray)
11:49 2026-05-13 UTC--4
Analiza kursów walut

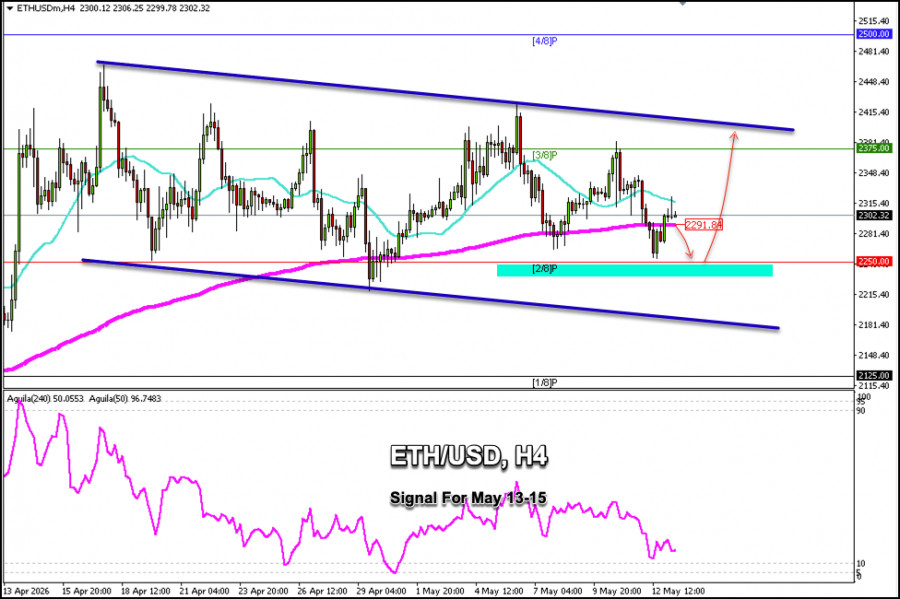
ETH/USD is trading around $2,303, above the 21-day SMA and the 200-day EMA, showing a technical rebound but also signs of exhaustion. ETH is trading within a range of $2,435 to $2,200.

According to the H4 chart, we can see that Ethereum is within a bearish trend channel formed since April 15. If the price falls below $2,300, it could continue its downward movement until it finds the 2/8 Murray support around $2,250.

The 2/8 Murray support level could provide a good technical bounce for ETH/USD and could be seen as an opportunity to open long positions with targets at $2,291 and $2,375.

A sharp drop below $2,250 could extend the decline to the lower band of the bearish trend channel around $2,180, and the instrument could even reach the 1/8 Murray line around $2,125.

Our trading plan for the coming hours is to sell Ethereum below $2,300 toward the 6/8 Murray level and buy above the 6/8 Murray level with targets toward the 21 SMA.

Opinie

ForexMart is authorized and regulated in various jurisdictions.

(Reg No.23071, IBC 2015) with a registered office at First Floor, SVG Teachers Co-operative Credit Union Limited Uptown Building, Corner of James and Middle Street, Kingstown, Saint Vincent and the Grenadines

Restricted Regions: the United States of America, North Korea, Sudan, Syria and some other regions.


aWS
© 2015-2026 Tradomart SV Ltd.
Top Top
Ostrzeżenie o ryzyku:
Kontrakty CFD są złożonymi instrumentami i wiążą się z wysokim ryzykiem szybkiej utraty pieniędzy z powodu dźwigni finansowej. 71.71% kont inwestorów detalicznych traci pieniądze podczas handlu kontraktami CFD. Zastanów się, czy rozumiesz, jak działają kontrakty CFD i czy możesz sobie pozwolić na wysokie ryzyko utraty pieniędzy.