Index S&P 500 v úterý klesl, protože investoři vstřebávali slabé údaje o maloobchodním prodeji a pokračující konflikt mezi Izraelem a Íránem se zdá být na pokraji další eskalace, když prezident Trump nyní vyzývá Írán k „bezpodmínečné kapitulaci“.
Ve 20:57 SEČ index Dow Jones Industrial Average klesl o 335 bodů, tj. o 0,8 %, index S&P 500 poklesl o 0,8 % a index Nasdaq Composite o 0,9 %.
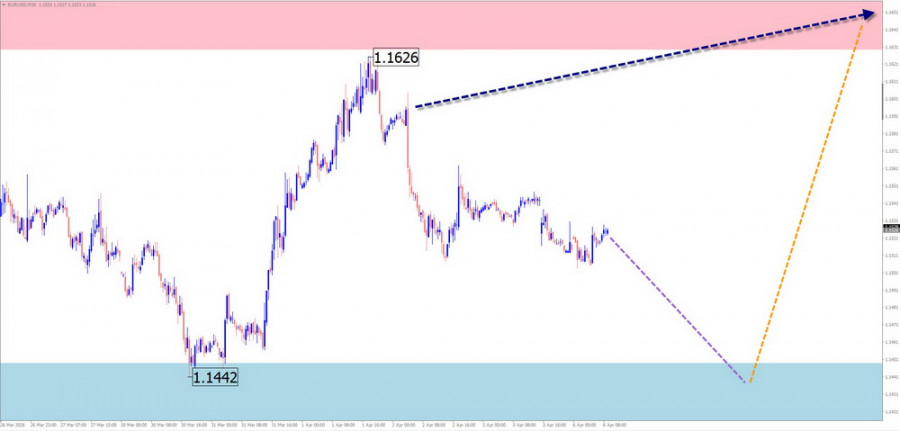
EUR/USD
Analysis: On the chart of the euro, price movement since late January has been defined by a downward wave algorithm. Over the past month, the wave structure has formed a corrective flat. The price extremes have created a horizontal channel. The final part (C) is developing within the correction structure.
Forecast: Next week, sideways movement is expected within opposing zones. Early in the week, a downward movement toward the lower boundary of the channel is likely. Growth may resume closer to the weekend.
Potential reversal zones
Resistance:
Support:
Recommendations:Selling: May be profitable with reduced position size and short intraday trades.Buying: Premature until reversal signals appear near resistance.
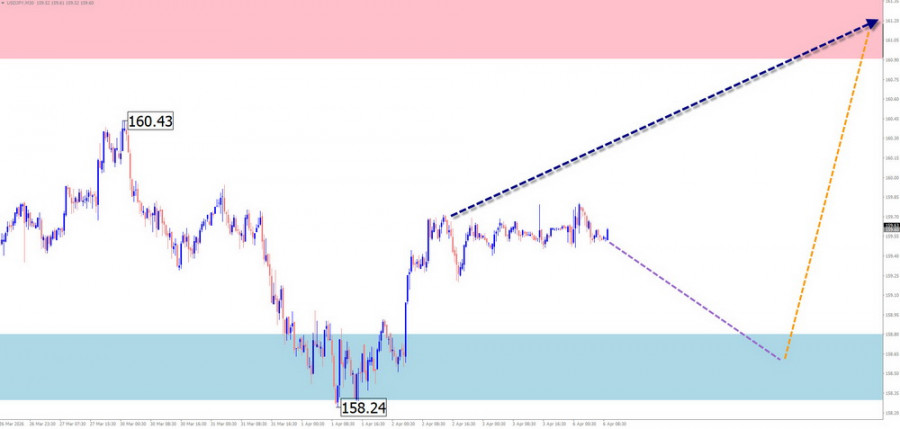
USD/JPY
Analysis: The upward wave that began in April last year is forming its final part (C). Since March 13, a counter correction has been developing, taking the form of a shifting flat and not yet complete.
Forecast: In the coming days, sideways movement along the support zone is expected. A brief dip below support is possible. Later, conditions for a reversal may form, with growth resuming in the second half of the week.
Potential reversal zones
Resistance:
Support:
Recommendations:Selling: High risk, low potential.Buying: Relevant after confirmed reversal signals near resistance.
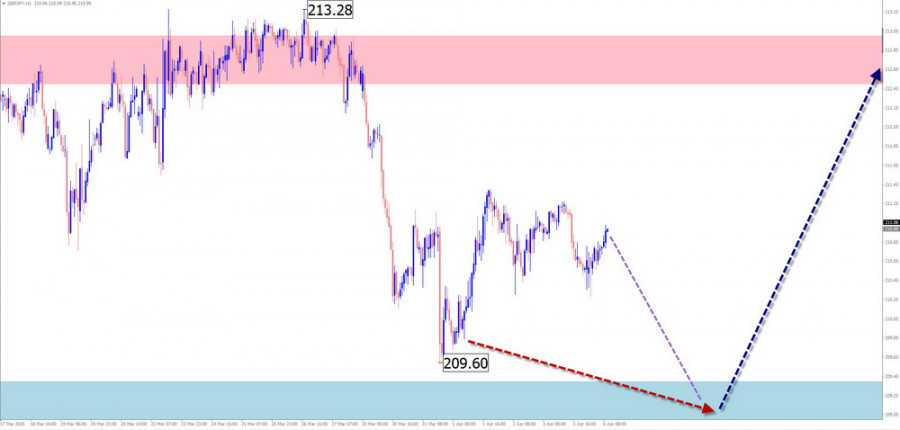
GBP/JPY
Analysis: Since July last year, the main direction has been upward. After a zigzag wave ended in late January, a new upward segment began forming during a flat phase. The middle part (B) of this wave is nearing completion.
Forecast: In the next couple of days, sideways movement with a slight downward bias is expected. A reversal may form near support, with upward movement resuming in the second half of the week.
Potential reversal zones
Resistance:
Support:
Recommendations:Selling: High risk, low potential.Buying: Attractive after confirmed reversal signals near resistance.
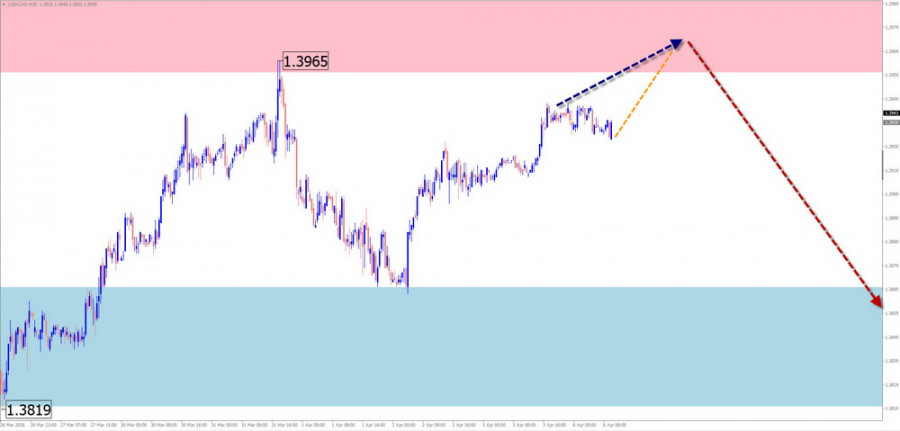
USD/CAD
Analysis: The 4-hour chart shows the formation of an upward wave starting from late January. The structure is not yet complete. Since late March, a downward corrective move with reversal potential has been forming.
Forecast: In the next few days, sideways movement is expected, with a possible rise toward resistance. In the second half of the week, a reversal and decline toward support is likely. This support aligns with a strong higher timeframe reversal zone.
Potential reversal zones
Resistance:
Support:
Recommendations:Selling: Risky, limited potential.Buying: Possible after signals appear; upside is limited by resistance.
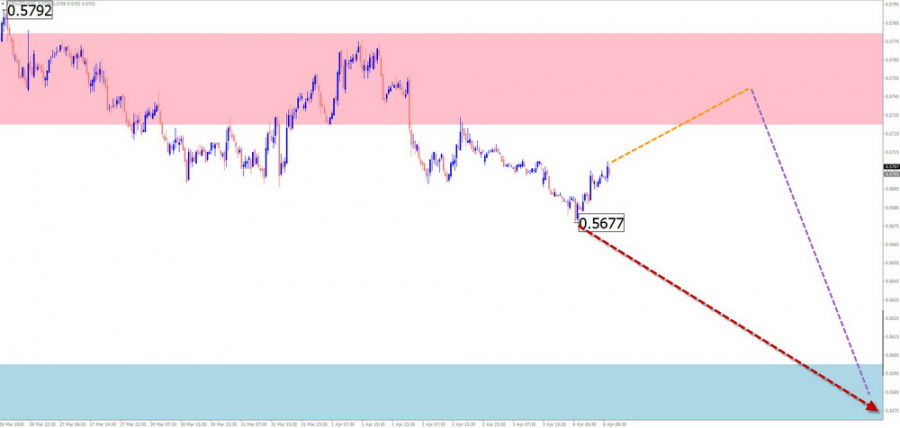
NZD/USD
Analysis: The short-term unfinished wave is downward, starting from late January. In recent weeks, an internal correction has formed. The downward move since April 3 has reversal potential.
Forecast: At the start of the week, sideways movement is expected. A temporary upward move toward resistance is possible. After that, a reversal and continued decline are likely. The support zone marks the lower boundary of the expected weekly range.
Potential reversal zones
Resistance:
Support:
Recommendations:Buying: High risk, low potential.Selling: May become the main strategy after confirmed reversal signals near resistance.
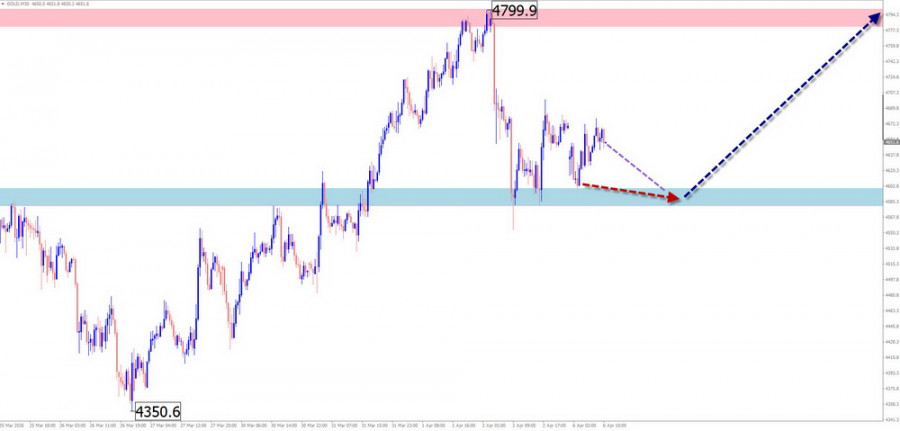
Gold
Analysis: The short-term wave in gold has been downward since January 29. Over the past two months, prices have moved sideways, forming a corrective part (B) in the shape of a shifting flat. The correction is not yet complete. Price is approaching the lower boundary of a higher timeframe reversal zone.
Forecast: In the next couple of days, sideways movement is most likely, possibly with a decline toward support. In the second half of the week, volatility may increase, with a reversal and renewed upward movement.
Potential reversal zones
Resistance:
Support:
Recommendations:Selling: Limited potential, risk of losses.Buying: Relevant after confirmed signals near support.
Notes: In simplified wave analysis (SWA), all waves consist of three parts (A–B–C). The analysis focuses on the latest unfinished wave on each timeframe. Dashed lines indicate expected movements.
Important: Wave analysis does not account for the duration of price movements in time.

SZYBKIE LINKI


 Skontaktuj się z ForexMart

