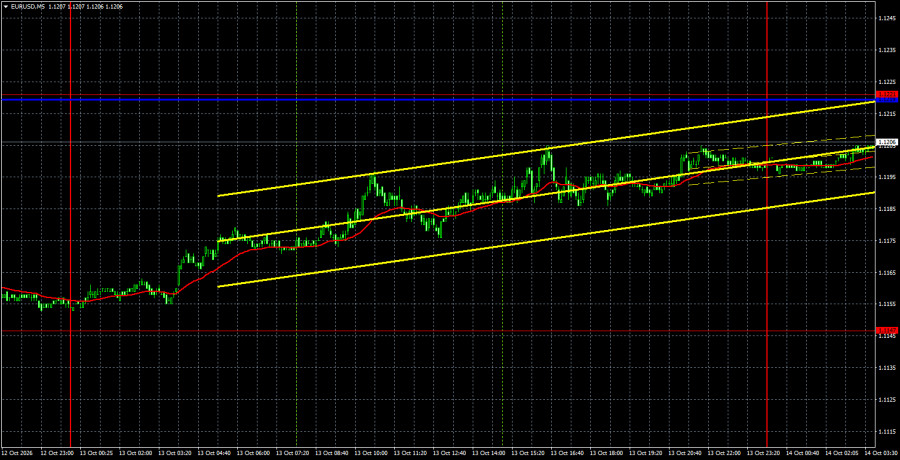
The EUR/USD currency pair on Tuesday once again began an upward move within the month-long, non-rebounding downtrend. Price has approached the trendline again and will attempt to break it today. However, given market behavior over the past month, we have no confidence that even a trendline break will change the trend. If price closes above the trendline and the Kijun-sen line, a stronger correction toward the Senkou Span B line can be expected. But the euro's more serious prospects remain highly uncertain due to the market's aggressively bearish sentiment. On Monday and Tuesday, no major economic events occurred in the Eurozone or the US. The world watched another attempt by Donald Trump to end what he called an energy truce, which produced nothing: Kyiv and Moscow did not agree to an energy truce. Thus, the situation for the euro and the dollar has not changed.
Technically, the downtrend formation continues. The market has been buying the dollar for the fifth consecutive week. The trendline remains relevant; price sits below the Ichimoku lines, so the pair's decline is fully logical from a technical perspective. Expecting euro recovery makes sense only after the trendline is breached.
On the 5-minute timeframe on Tuesday, no trading signals were formed. Price moved in one direction throughout the day but initially failed to work the 1.1147 level. Price is now approaching the 1.1220–1.1221 area, where a trading signal may form.
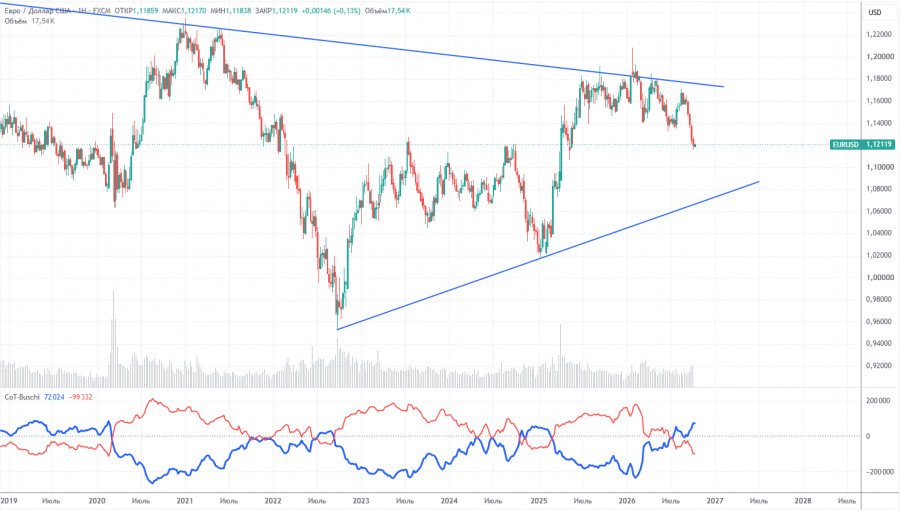
The latest COT report is dated October 6. The weekly timeframe illustration clearly shows that the net position of non-commercial traders remains "bearish" and has declined significantly in 2026 due to geopolitical events. Traders have been reducing euro exposure in favor of the US dollar over the past six months. Trump's policies have not changed, but the dollar has long served as a "reserve" currency.
However, we still do not see any fundamental factors that would further strengthen the US currency. The war in the Middle East made the dollar temporarily super-attractive, and the Federal Reserve's monetary policy stance surprised the dollar for the second time this year. In the long term, the euro could fall as low as $1.08 (the trendline), but the uptrend will remain relevant. Yet in recent weeks the market accounts only for positive factors for the dollar and ignores everything else.
The positioning of the red and blue indicator lines points to an approximate parity between bulls and bears. During the last reporting week, long positions in the "Non-commercial" group increased by 4,800, while shorts rose by 40,900. Accordingly, the net position decreased further by 36,100 contracts over the week.
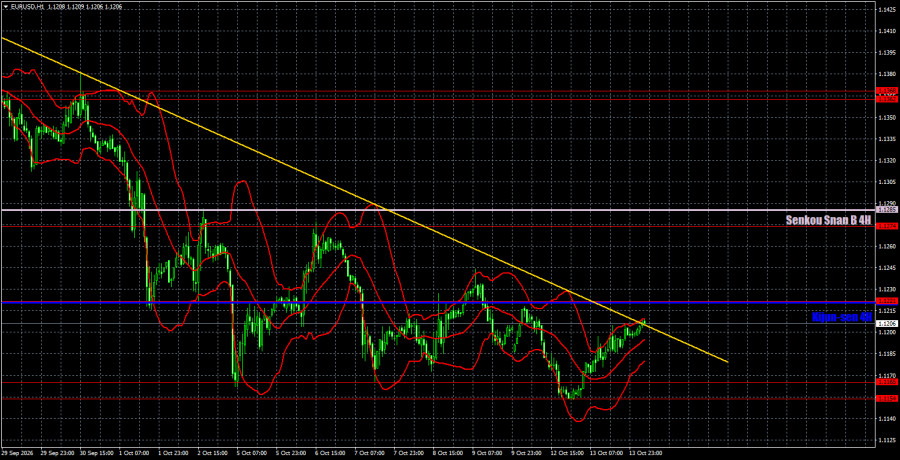
On the hourly timeframe, EUR/USD continues to form a downward trend. The Fed greatly aided the development of the downward trend, but that factor is unlikely to explain dollar strength several weeks after the meeting. The European Central Bank should have supported the euro, having already raised rates twice in 2026, and U.S. labour-market data should have weakened the dollar. But the market now sees no factors supporting the euro. Thus, the dollar continues to form a strong trend driven only by market sentiment.
For October 14 we highlight the following levels for trading — 1.1092, 1.1154–1.1165, 1.1221, 1.1274, 1.1362–1.1368, 1.1461–1.1473, 1.1536–1.1542, 1.1585, 1.1657–1.1665, as well as Senkou Span B (1.1285) and Kijun-sen (1.1220). The Ichimoku lines may shift during the day, so account for this when determining trading signals. Don't forget to move Your Stop Loss to breakeven if price has moved 15 pips in the right direction. This will protect against potential losses if the signal proves false.
On Wednesday, there are two speeches by ECB President Christine Lagarde in the Eurozone, which may interest traders. The last eurozone inflation report showed a sharp acceleration, so Lagarde's tone could be harsher than in previous remarks. In the US today, the "report of the week" on September inflation will be released. Headline CPI is expected to rise to 3.6%, and the higher the inflation print, the greater the chance of another dollar rally today.
Traders may consider targets for short positions around 1.1154–1.1165 if price rebounds from the 1.1220–1.1221 area. In case of a Kijun-sen breakout, consider targets for long positions at 1.1274–1.1285.

SZYBKIE LINKI




















 Skontaktuj się z ForexMart