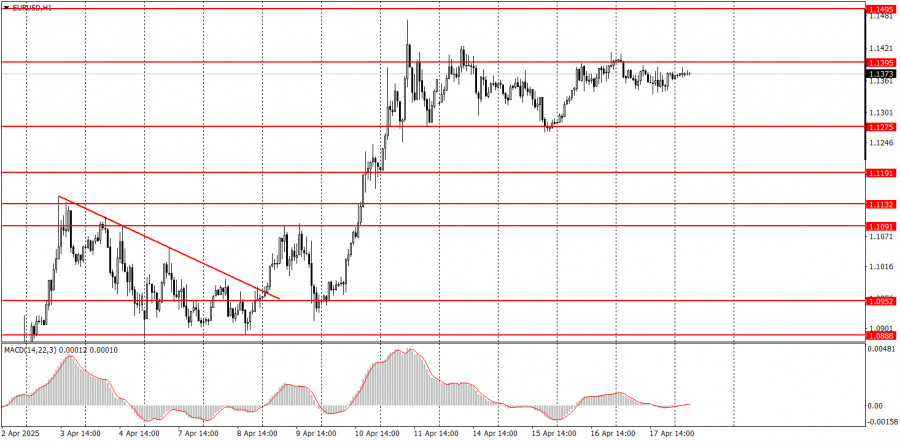
The EUR/USD currency pair continued trading within a sideways channel on Thursday, as shown on the hourly timeframe chart above. The current market situation is as straightforward as it gets. Yesterday, the European Central Bank held its meeting and decided to cut key interest rates for the seventh time. Neither the meeting nor the decision to ease monetary policy impacted the euro's movement. Yesterday's volatility was the lowest of the week despite Thursday's macroeconomic and fundamental background being much stronger than the previous days. Therefore, the conclusion is obvious: the market continues to trade exclusively based on news related to the trade war. If there's no such news, the market is reluctant to move, and the pair remains flat.
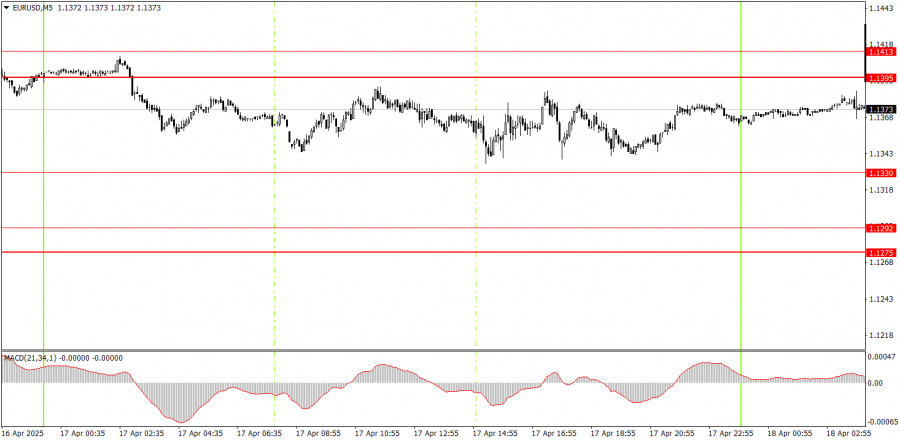
No trading signals were formed in the 5-minute timeframe on Thursday, and the price moved sideways throughout the day. Thus, there were no grounds to enter the market. Neither macroeconomic nor fundamental events influenced the pair's movement. Traders are still waiting for Donald Trump's new tariff-related decisions.
The EUR/USD pair remains in an uptrend on the hourly timeframe. It is uncertain how long this will last, as no one knows how many more tariffs Trump will implement. Repeated escalations of the trade war are entirely possible since many countries plan to retaliate in kind — something unlikely to please the U.S. president. Due to Trump's "discounts," the dollar failed to strengthen, as the trade confrontation between the U.S. and China has taken center stage, and there are no positive signals in that direction. All other macroeconomic and fundamental data currently carry almost no weight.
On Friday, the pair may continue to trade sideways. We don't make predictions on movement, as trade war-related headlines can break at any moment. Therefore, the price can "shoot" up or down anytime.
On the 5-minute chart, the following levels should be considered: 1.0797–1.0804, 1.0859–1.0861, 1.0888–1.0896, 1.0940–1.0952, 1.1011, 1.1091, 1.1132–1.1140, 1.1189–1.1191, 1.1275–1.1292, 1.1330, 1.1395–1.1413, 1.1474–1.1483. No significant data releases are scheduled for Friday in the Eurozone or the U.S. However, headlines from the White House can emerge anytime, so traders should be prepared for renewed market turbulence.
Support and Resistance Levels: These are target levels for opening or closing positions and can also serve as points for placing Take Profit orders.
Red Lines: Channels or trendlines indicating the current trend and the preferred direction for trading.
MACD Indicator (14,22,3): A histogram and signal line used as a supplementary source of trading signals.
Important Events and Reports: Found in the economic calendar, these can heavily influence price movements. Exercise caution or exit the market during their release to avoid sharp reversals.
Forex trading beginners should remember that not every trade will be profitable. Developing a clear strategy and practicing proper money management are essential for long-term trading success.

LINKS RÁPIDOS


 Contate-nos

