EUR/USD
Analysis:
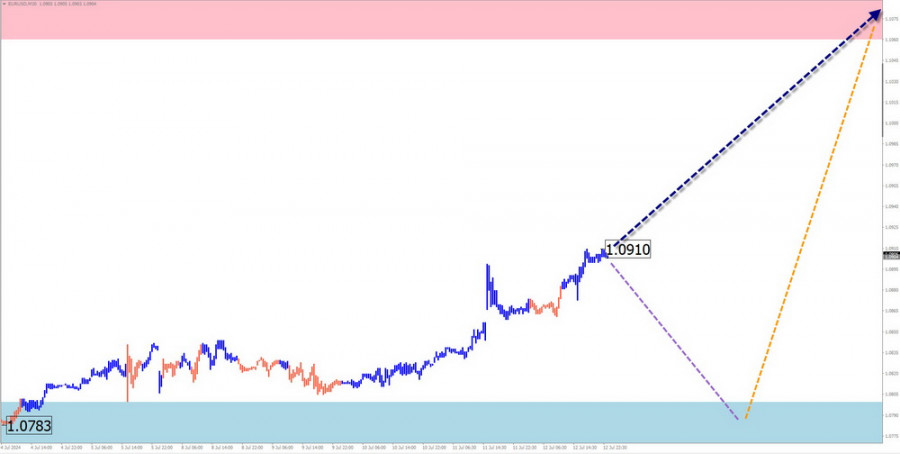
The dominant upward wave that started in April of this year continues on the chart of the major European currency pair. After breaking through a strong resistance level, the quotes continued their path to the upper part of the price chart. The calculation of the preliminary target zone shows a probable growth potential of around three price figures from the current rate.
Forecast:
In the upcoming week, the bullish vector of price movement is expected to continue dominating. At the beginning of the week, a short-term pullback down to the support zone cannot be ruled out. After that, a reversal formation and the resumption of the upward movement vector can be expected.
Potential Reversal Zones
Resistance:
Support:
Recommendations:
Sales: There will be no conditions for such transactions in the coming week.
Purchases: They may become profitable when monitoring emerging reversal signals around the support zone.
USD/JPY
Analysis:
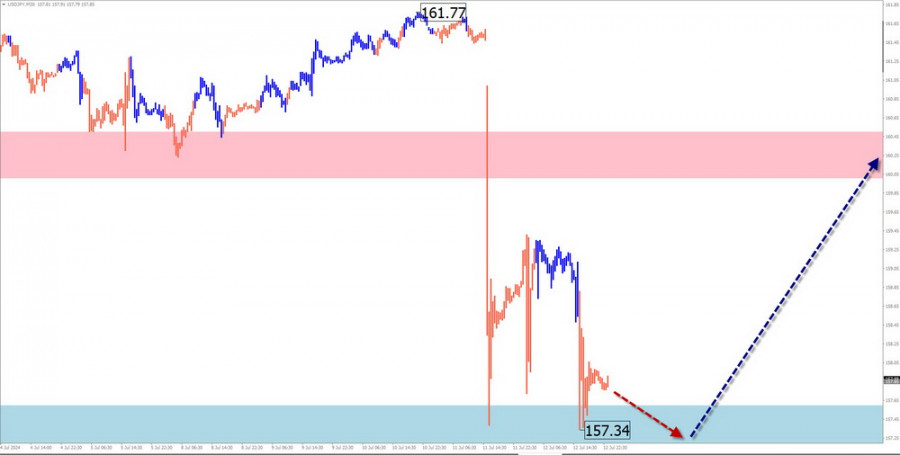
The daily chart scale of the main pair with the Japanese yen demonstrates the formation of an ascending wave model since July of last year. Its unfinished segment counts from May 3. In the past couple of weeks, the correction wave (B) within this structure is approaching its completion. The price is nearing the upper boundary of a strong potential reversal zone.
Forecast:
At the beginning of the upcoming week, the completion of the bearish movement vector is expected. In the area of the calculated support, a reversal formation can be expected thereafter. A brief breach of the lower boundary of the zone cannot be ruled out upon the change of course. Resumption of the upward direction is more likely towards the end of the week.
Potential Reversal Zones
Resistance:
Support:
Recommendations:
Sales: Risky, may lead to portfolio losses.
Purchases: Monitoring emerging reversal signals around the support zone can be profitable.
GBP/JPY
Analysis:
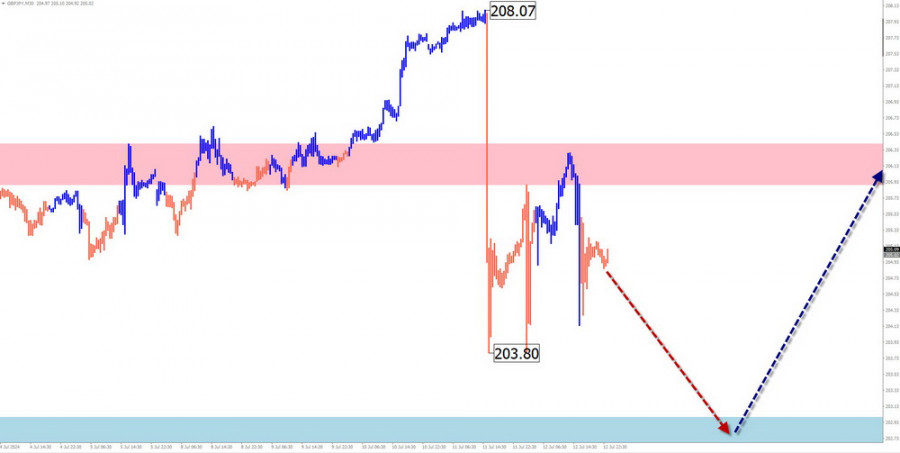
The price movement of the GBP/JPY cross is oriented "north" on the price chart. This trend is confirmed by the trend of the higher timeframe. The price has reached the boundaries of the weekly-scale potential reversal zone. Within its structure, a corrective movement has been developing since last week. At the time of analysis, it remains within the bounds of an irregular correction, forming its final part (C).
Forecast:
At the beginning of the upcoming weekly period, continuation of the downward movement vector can be expected, until the completion of the corrective wave. Subsequently, a price reversal and resumption of the upward trend are anticipated. A breakout beyond the expected range during the upcoming week is unlikely.
Potential Reversal Zones
Resistance:
Support:
Recommendations:
Sales: May be profitable within individual sessions with reduced volume size. It is recommended to close deals at the first signs of a reversal.
Purchases: Will become relevant after signals of a change in direction appear around the calculated support area.
USD/CAD
Analysis:
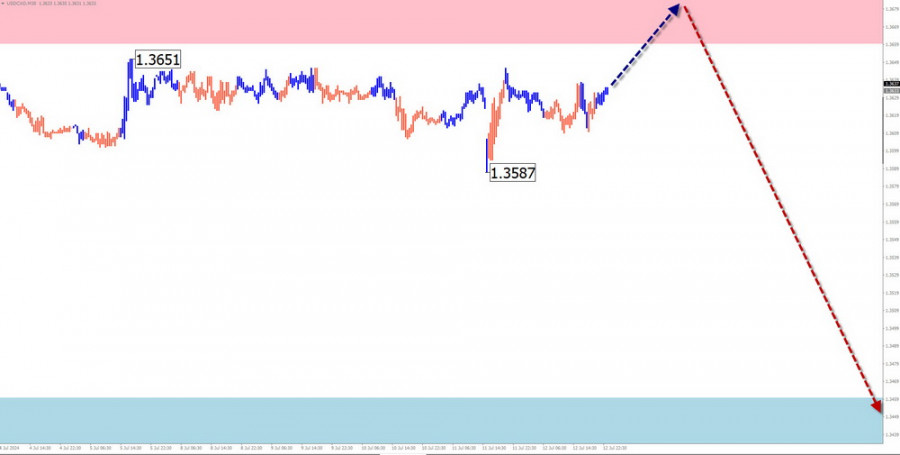
The price movement direction of the Canadian dollar in the main pair since mid-April of the current year is determined by a descending wave algorithm. Looking at the weekly scale chart shows the corrective nature of this movement. In recent weeks, the price has been predominantly moving sideways, along the upper boundary of the potential reversal zone on the weekly timeframe.
Forecast:
At the beginning of the upcoming week, continuation of the current retracement vector is expected. In the second half of the week, a reversal and resumption of the bearish movement direction can be anticipated. Against the backdrop of significant news releases, a sharp increase in volatility cannot be ruled out.
Potential Reversal Zones
Resistance:
Support:
Recommendations:
Purchases: May bring profit within individual sessions with reduced volume size. It is recommended to close deals at the first signs of a reversal.
Sales: Will become relevant after signals of a change in direction appear around the calculated support area. It is safer to reduce the volume size.
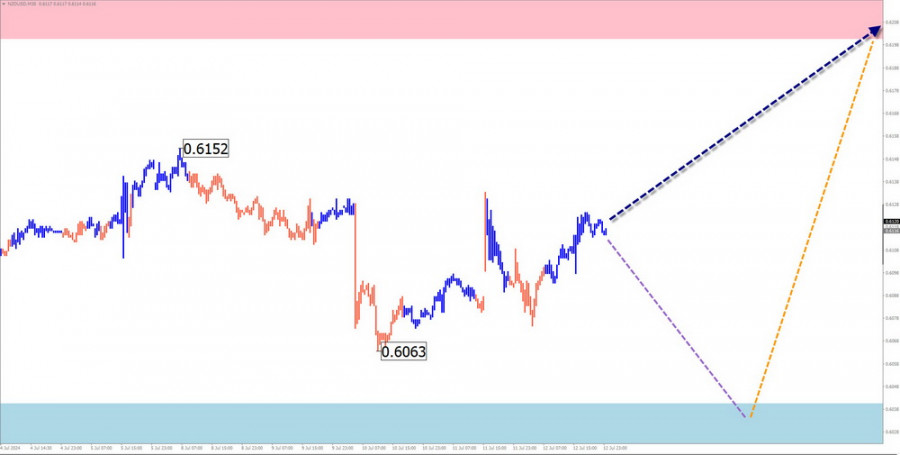
NZD/USD
Brief Analysis:
On the chart of the main pair of the New Zealand dollar, an ascending wave zigzag has been forming since April. The average correction part (B) began counting from May 31st. The price has reached the lower boundary of a strong potential reversal zone on a daily scale. The upward segment from July 10th has reversal potential. Upon confirmation, it will mark the beginning of the final part (C) of the short-term trend.
Weekly Forecast:
In the first days of the upcoming week, sideways movement can be expected. There might be a decline towards the support zone boundaries. Later, a reversal is anticipated with subsequent price increase towards the resistance zone. Upon a change in direction, a brief breach of the lower boundary of the support zone cannot be ruled out. Increased volatility is most likely towards the end of the week.
Potential Reversal Zones
Resistance:
Support:
Recommendations:
Sales: After confirmed reversal signals appear, they may become the primary direction for trading transactions.
Purchases: Fractional volumes may be used within individual sessions. The potential is limited by resistance.
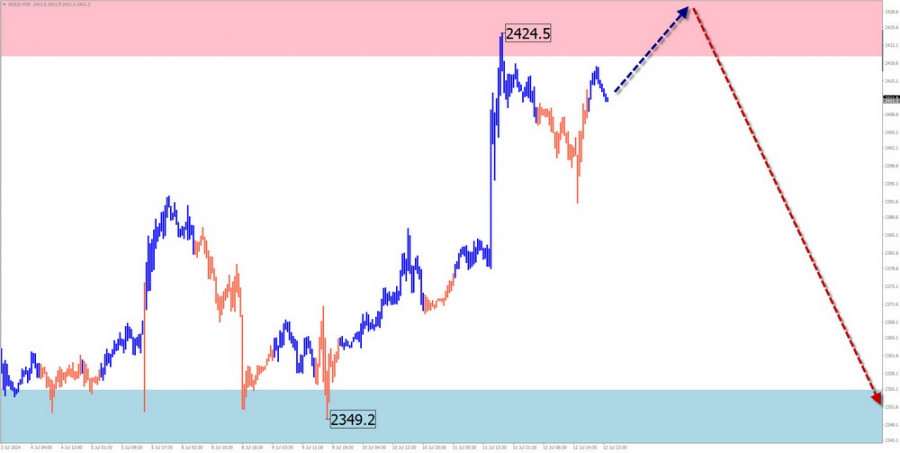
Gold
Analysis:
The latest incomplete wave structure of the gold index at the time of analysis dates back to October of last year. In this ascending wave, the price has been forming a corrective part (B) for the past three months. The unfinished segment started counting on June 7th. The wave structure is nearing completion. The downward segment since July 11th has reversal potential.
Forecast:
At the beginning of the current week, one can expect the completion of the upward price movement vector, up to the full completion of the price increase around the calculated resistance area. Then, the probability increases of a change in direction and the beginning of a decline in the price of gold. The support zone shows the lower boundary of the expected weekly movement of the instrument.
Potential Reversal Zones
Resistance:
Support:
Recommendations:
Sales: After the appearance of corresponding confirmed signals from your trading system, they may become the primary direction for trading transactions.
Purchases: Risky, and may result in losses. It's optimal to stay out of the instrument market until reversal signals appear.
Notes: In simplified wave analysis (SWA), all waves consist of 3 parts (A-B-C). The latest unfinished wave is analyzed at each timeframe. Dashed lines indicate expected movements.
Attention: The wave algorithm does not account for the duration of instrument movements over time!

RÁPIDOS ENLACES
ForexMart is authorized and regulated in various jurisdictions.
(Reg No.23071, IBC 2015) with a registered office at Shamrock Lodge, Murray Road, Kingstown, Saint Vincent and the Grenadines
Restricted Regions: the United States of America, North Korea, Sudan, Syria and some other regions.


 Contáctenos