S&P500
Market review on March 7
Snapshot of benchmark US stock indices on Thursday
Dow Jones: -1.0%
NASDAQ: -2.6%
S&P 500: -1.8%
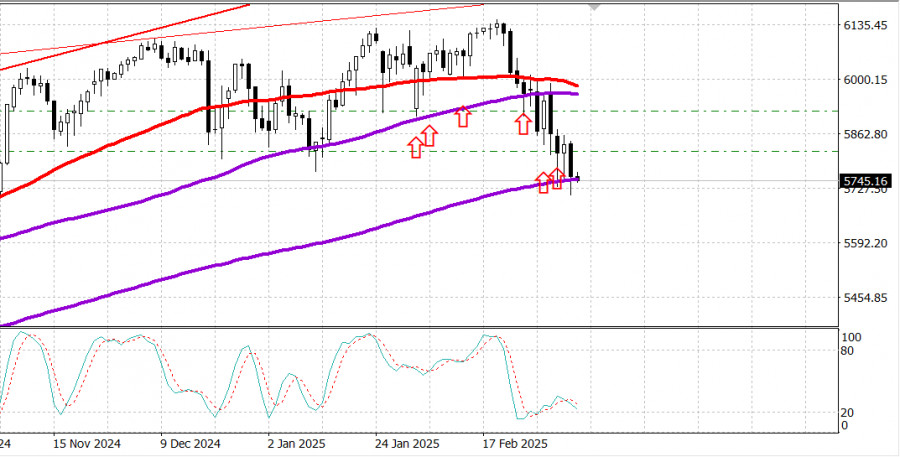
S&P 500: 5,738, range: 5,650 – 6,200
The stock market took another nosedive on Thursday after a brief pause on Wednesday.
As in previous sessions, the rhetoric of the White House regarding US trade policy negatively impacted the stock market.
The S&P 500 briefly fell below its 200-day moving average at 5,730, hitting a session low of 5,711 before closing just above this key technical level. However, the Nasdaq Composite (-2.6%) and Russell 2000 (-1.6%) dropped well below their respective 200-day moving averages.
Nasdaq in correction territory
The Nasdaq Composite closed on Thursday with a 10.4% plunge from its all-time high on December 16, officially putting the index in correction territory.
The S&P 500 is now 6.6% below its all-time high after Thursday's broad sell-off.
Trade policy & market reaction
The market attempted a brief recovery in the mid-morning session after Commerce Secretary Lutnick told CNBC that all goods and services compliant with USMCA would be exempt from new tariffs for one month. However, the rebound was short-lived, and the market remained in a steady downtrend by the time President Trump signed an order detailing exemptions in the afternoon.
Still, 62% of Canadian goods and 50% of Mexican goods remain subject to tariffs, with tariff exemptions set to expire on April 2.
Mega-cap & semiconductor sell-off
The sell-off in mega-cap stocks and semiconductor companies dealt a blow to the broader market, reflecting the flood of speculative trades.
NVIDIA (NVDA 110.57, -6.73, -5.7%) was a key catalyst for the decline.
Marvell Technology (MRVL 72.28, -17.86, -19.8%) issued disappointing guidance, which contributed to weakness in the semiconductor sector.
Year-to-date market performance:
Dow Jones Industrial Average: +0.1%
S&P 500: -2.4%
S&P Midcap 400: -4.9%
Nasdaq Composite: -6.4%
Russell 2000: -7.3%
Economic calendar on Thursday
Previous figure revised from -$98.4 billion to -$98.1 billion.
Key takeaway: Anticipation of new tariffs led to a surge in imports, which will weigh on Q1 GDP forecasts.
Previous: 242,000
Weekly continuing jobless claims: 1.897 million
Previous revised from 1.862 million to 1.855 million
Key takeaway: The decline in initial jobless claims—a leading indicator—eases concerns about a weakening labor market.
Previous: +1.2%
Previous: +3.0%
Key takeaway: Higher productivity and lower labor costs are positive for market sentiment, as improved productivity offsets inflationary pressures.
Previous revised from -0.5% to -0.4%
Economic calendar on Friday
Energy. Brent crude is now trading at $69.50. Oil remains under pressure due to the sell-off of US stocks.
Forex news
The ECB cut interest rates by 0.25% on Thursday, March 6.
However, despite a sharp rally of EUR/USD to 1.0800 before the decision, the euro gave a muted response to the ECB rate cut.
For smart traders, this is a key signal that EUR/USD is able to maintain bullish momentum.
So, it's a good idea to keep long positions from support levels.
Conclusion:
The US stock market remains under heavy pressure, but economic data remains stable. The ISM services index for February showed stronger-than-expected growth, and weekly jobless claims remain low, signaling a strong labor market. The S&P 500 attempting to hold above its 200-day moving average is a positive sign.
Strategy: maintain buy positions from key support levels—current prices present attractive entry points for long-term investors.

RÁPIDOS ENLACES


 Contáctenos