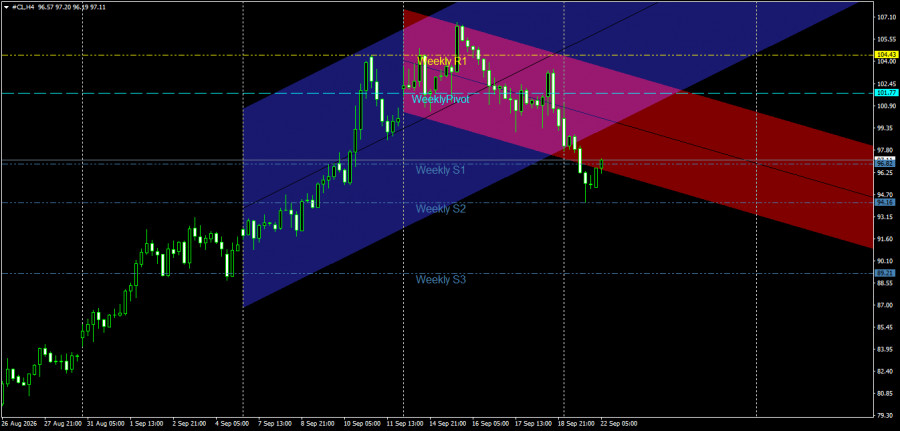
The 4-hour (H4) chart for Crude Oil (#CL) futures reveals a significant technical shift in price trend. The price is currently trading around the 97.11 level, driven by a sharp decline following the breach of the previous uptrend and an exit from the primary price channel.
Technical Analysis and Price Action
Break of the Ascending Channel and Trend Shift: Oil had been moving within a primary ascending channel (blue), reaching a local peak near the first weekly resistance level (Weekly R1) at 104.43. Subsequently, the price faced intense selling pressure, breaking the lower boundary of the blue channel and establishing itself within a steeper, minor descending channel (red/pink).
Retreat Below Weekly Pivot Levels: The price lost its footing above the Weekly Pivot (101.77) and continued to fall, breaking the first weekly support (Weekly S1) at 96.82. It recorded an interim low near the 94.16 level (Weekly S2) before attempting a minor corrective rebound.
Key Support and Resistance Levels
Key Resistance Levels:
Resistance 1: 96.82 (The broken Weekly S1 support level, which has now turned into resistance).
Resistance 2: 101.77 (Weekly Pivot).
Key Resistance: 104.43 (Weekly R1 and the previous peak). Key Support Levels:
First Support: 94.16 (Weekly S2 level and intraday low).
Second Support: 91.60 (Psychological and technical support barrier within the red channel).
Key Support: 89.21 (Weekly S3 level).
Price Action Outlook and Trading Recommendations
Bearish Scenario (Primary):
Continuing the bearish trend is the most likely and appropriate outlook as long as the price trades below the weekly pivot level of 101.77 and within the boundaries of the red bearish channel.
Recommendation: Sell oil upon a retest of the resistance zone between 96.82 and 97.80, or if the price holds below the pivot level.
Technical Targets: Re-targeting the Weekly S2 level at 94.16 as the first target; a break below this opens the way for a decline toward 89.21 (Weekly S3) as the second target.
Stop Loss: A 4-hour candle close above 98.50 or above the pivot point at 101.77.
Bullish Corrective Scenario (Alternative):
This scenario is triggered only if buyers succeed in reclaiming the pivot level and breaking out of the bearish channel.
Validation Condition: Breaking the 101.77 level and closing above 102.50 with a full 4-hour candle.
Technical Targets: Returning to target the first weekly resistance level at 104.43. Risk Management
Given the high volatility in energy markets, it is advisable to strictly adhere to capital management principles and clearly define stop-loss targets, while avoiding trades that risk more than 1% to 2% of the total trading portfolio.
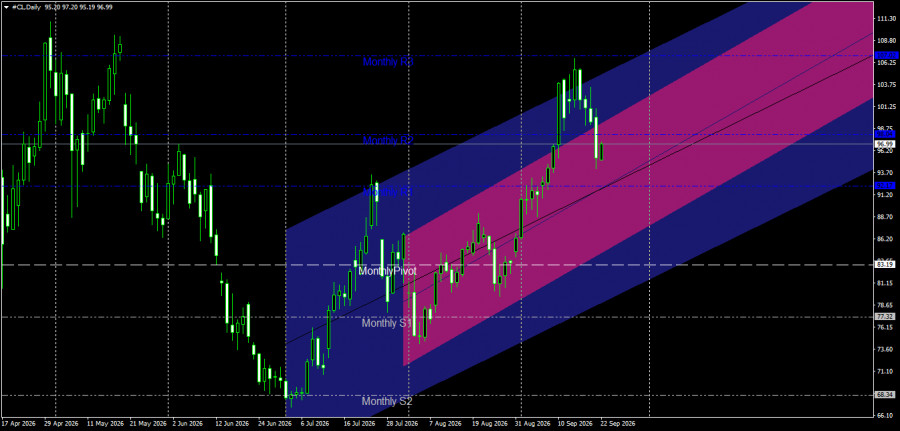
The daily chart for crude oil contracts (#CL, Daily) reveals significant price action reflecting a gradual shift from a prior downtrend to a clear, stable uptrend. This transition is accompanied by the formation of an ascending price channel and the plotting of monthly Camarilla/Pivot Point levels.
Technical Analysis of the Current Situation
Overall Trend and Ascending Price Channel:
The price underwent a strong bearish move from late April through late June 2026, establishing a major low near the 68.34 level (close to the Monthly S2 support level).
Following this low, the price began a steady upward movement within an ascending price channel (marked in blue and purple), signaling that buyers have regained control of the overall trend.
**Analysis of Monthly Pivot Points and Resistance Levels:**
**Monthly Pivot Point:** Located at 83.19. The price successfully broke above this level and stabilized there previously, reinforcing the bullish outlook.
**Monthly Resistance 1 (R1):** Located at 92.17; this level was previously surpassed and now potentially serves as a support zone.
**Monthly Resistance 2 (R2):** Located at 98.04 (near the 96.99 / 98.75 range).
**Monthly Resistance 3 (R3):** Located near the 107.02 level. Recent Price Action:
Following a strong, impulsive rally that broke through the second monthly resistance level—reaching the 106.25–107.02 zone near the upper boundary of the ascending channel—the price began a downward correction.
The current price on the chart is approximately 96.99 (with the closing price shown as 96.99 within a daily trading range of 95.19 to 97.20).
Second: Expected Price Action Scenarios
Scenario One (Primary – Bullish):
Retest and Rebound: The price is currently trading near the ascending channel's midline and the previously broken resistance level (Monthly R2 at 98.04 / 96.20).
If the price successfully rebounds from these zones (between 95.00 and 96.20) and stabilizes above the channel's internal trend line, the bullish trend is expected to resume. This would target a new high towards the third monthly resistance (Monthly R3) at 107.02, followed by the channel's upper boundary around the 111.30 level.
Scenario Two (Alternative – Bearish Correction):
Should selling pressure intensify, leading to a break and stabilization below the 95.19 level, the corrective decline could extend to test the target support level: the previously broken first monthly resistance (Monthly R1) at 92.17.
The 92.17–91.20 range is considered a prime, pivotal support zone for buying, provided the price continues to trade above the monthly pivot point (83.19). Conclusion and Recommendation
The technical outlook for crude oil prices remains positive and bullish over the medium and long term, supported by continued trading within the ascending price channel and above the monthly pivot point of 83.19. The current pullback is classified as a healthy corrective move aimed at establishing a "higher low" to facilitate a future resumption of the upward trend.

RÁPIDOS ENLACES



















 Contáctenos