The EUR/USD currency pair traded again on Thursday with low volatility, but within the trend on the hourly TF — i.e., a downtrend. Around mid-day, there was a collapse (by current volatility standards) of about 50 pips, which, for the euro, in recent weeks can be considered a record. The collapse occurred out of nowhere. Macroeconomic data had nothing to do with the decline. Of course, many experts may say that reports on US initial jobless claims and the Philadelphia business activity index came in better than forecasts and triggered dollar strength. But those reports were released several hours after the pair began to fall.
And in the morning, the EU published reports on industrial production and Germany's GDP. If the latter can be safely called "neutral," the former came in better than forecasts. Therefore, in the morning, the euro should have risen. The situation is rather strange: the market ignored the European background, while the US data were "worked" several hours before they were published? From this, we conclude that the pair continues a technical fall within the daily TF sideways channel 1.1400–1.1830 and within a downtrend on the hourly TF.
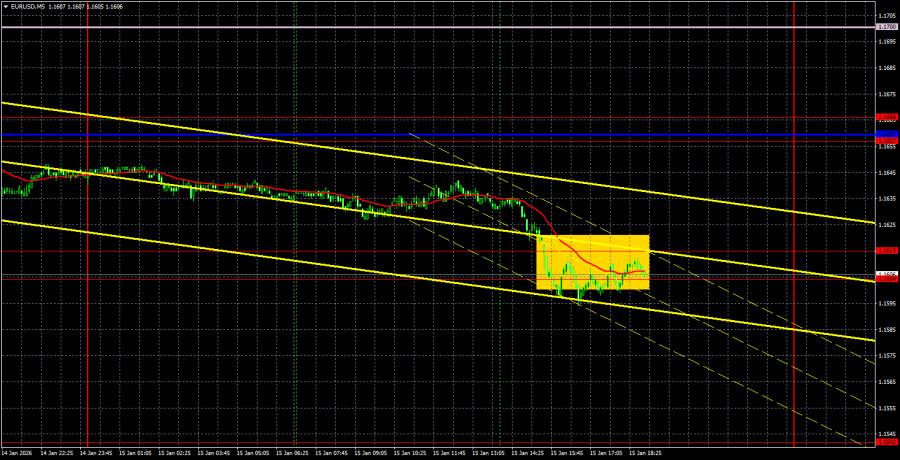
On the 5-minute TF, the last trading signal was formed already on Wednesday, but volatility is low now, so trades must be kept open for several days to allow targets to be reached. On Wednesday, the price rebounded from the 1.1657–1.1666 area, and on Thursday it worked the 1.1604–1.1615 area. Thus, the only signal over two days produced a small profit.
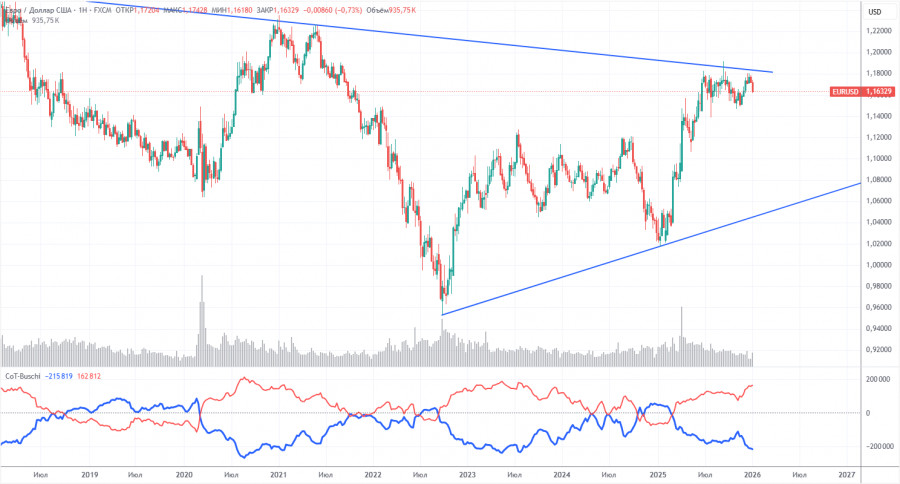
The latest COT report is dated January 6. The illustration above clearly shows that the net position of non-commercial traders was bullish for a long time; the bears barely gained superiority at the end of 2024,, but quickly lost it. Since Trump took office for a second time as US president, only the dollar has been falling. We cannot say the US currency's decline will continue with 100% probability, but current world events suggest that is a possibility. The red and blue lines diverge from each other, indicating strong bull dominance.
We still do not see any fundamental factors for the euro's strengthening, while there remain plenty of factors for the US currency's decline. The global downtrend still persists, but what does it matter where the price moved in the last 17 years? Over the past three years, only the euro has been rising, and that is also a trend.
The positions of the red and blue indicator lines continue to signal the preservation and strengthening of the bullish trend. During the last reporting week, the number of longs in the "Non-commercial" group increased by 3,500, while shorts decreased by 1,800. Accordingly, the net position rose by another 5,300 contracts over the week.
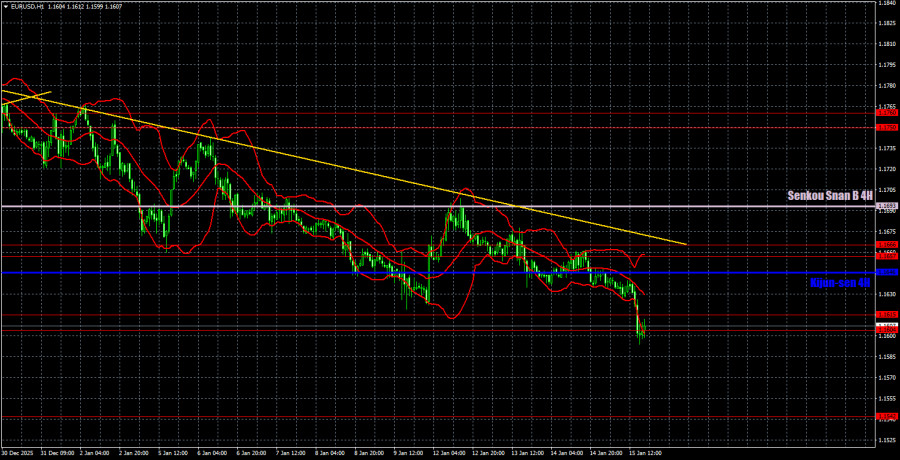
On the hourly TF, the EUR/USD pair continues to form a downtrend, during which it falls almost every day. Several weeks ago, the upper line of the sideways channel 1.1400–1.1830 was tested twice, but the euro failed to break out of it. Thus, the pair's decline is technically justified. To count on euro growth and a new attempt to overcome the 1.1800–1.1830 area, one should at least wait for a breakout of the trendline.
For 16 January, we highlight the following trading levels: 1.1234, 1.1274, 1.1362, 1.1426, 1.1542, 1.1604–1.1615, 1.1657–1.1666, 1.1750–1.1760, 1.1846–1.1857, 1.1922, 1.1971–1.1988, and also the Senkou Span B (1.1700) and Kijun-sen (1.1659) lines. Ichimoku indicator lines may shift during the day, which should be taken into account when determining trading signals. Don't forget to move a Stop Loss to breakeven if the price moves 15 pips in your favor. This will protect against possible losses if the signal proves false.
On Friday, the EU has only the second estimate of German inflation scheduled, and in the US, industrial production. The latter report has generated little interest, but the market has traded exclusively on technicals in recent weeks and months.
On Friday, traders can trade from the 1.1604–1.1615 area. A close below this area will allow opening short positions targeting 1.1542. A rebound from this area — longs with targets at the critical line and the 1.1657–1.1666 area.

RÁPIDOS ENLACES


 Contáctenos