Německý kancléř Friedrich Merz v pátek uvedl, že bude usilovat o dohodu, na jejímž základě by americké automobily mohly být dováženy do Evropy bez cla výměnou za zrušení cel na stejný počet vozidel vyvážených do USA.
Merz to řekl na akci v Berlíně jen několik hodin po své první cestě do Washingtonu, kde jednal s americkým prezidentem Donaldem Trumpem: „Musíme zvážit, zda můžeme přijít s pravidlem kompenzace nebo něčím podobným.“
„Dohodli jsme se, že mezi Bílým domem a kancléřstvím budou dva zástupci, kteří budou nyní intenzivně jednat o německo-amerických obchodních vztazích,“ dodal.
Uvedl však, že obchodní jednání s USA zůstávají v kompetenci Evropské unie a že v pátek bude hovořit s předsedkyní Evropské komise Ursulou von der Leyenovou, aby ji informoval o výsledcích svých rozhovorů s Trumpem.
The EUR/USD currency pair rose slightly on Friday, but numerous events throughout the day kept volatility quite weak once again. It seems the market has not fully figured out what to do with all the information received, as the pair began to swing rapidly up and down in the second half of the day. Recall that on Friday, decent reports on business activity were published in the Eurozone. In Germany, solid reports on business activity were released. In the US, the main report of the day—the fourth-quarter GDP—significantly underperformed, coming in at half the forecast. And at the end of the day and the week, the US Supreme Court pleased traders by declaring Donald Trump's tariffs illegal, while Trump immediately imposed new tariffs, raising them to 15% the following day. With so much information, traders' heads are likely spinning.
From a technical perspective, the downward trend on the hourly timeframe remains intact. The price was unable to overcome the area of 1.1750-1.1760, nor did it manage to settle above the critical line. Thus, theoretically, the dollar can continue to rise, as it has over the past two weeks. There are still a few factors supporting it, while factors for decline have increased. However, the market is currently poised for a technical correction within the broader global upward trend.
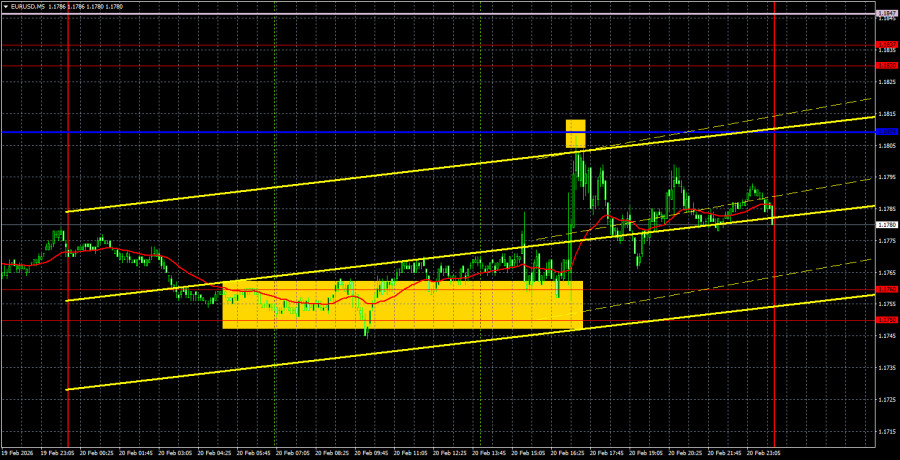
On the 5-minute timeframe, two trading signals were formed on Friday. During the first 10 hours, the price attempted to bounce off the 1.1750-1.1760 area, which it ultimately did. Traders could open long positions based on this signal. Then there was a "jump" to the Kijun-sen line, from which the price also rebounded. Therefore, traders were able to open short positions in succession. Both trades were profitable.
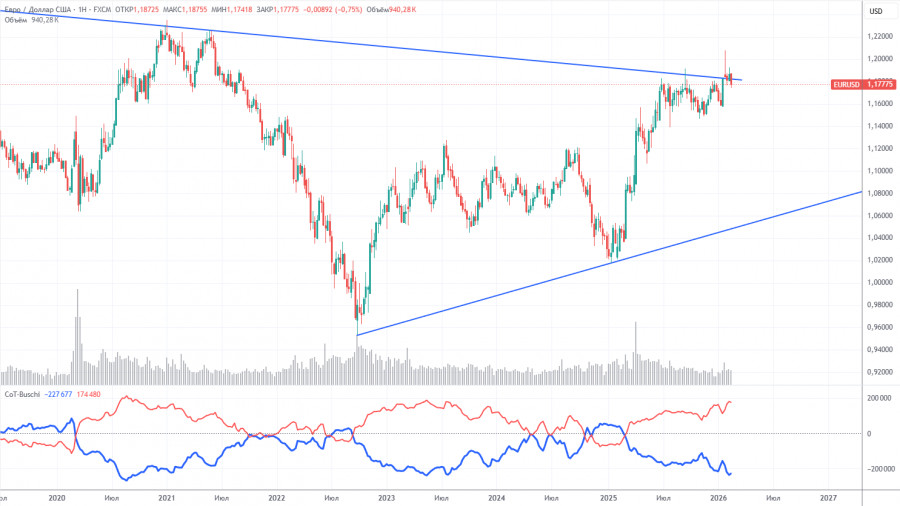
The latest COT report is dated February 17. The illustration on the weekly timeframe clearly shows that the net position of non-commercial traders remains "bullish." Since Trump took office as President of the United States for the second time, only the dollar has been falling. While we can't say with 100% certainty that the decline of the US currency will continue, current developments worldwide hint at this possibility.
We still do not see any fundamental factors supporting the strengthening of the euro, yet there are sufficient factors for the US dollar's decline. The global downward trend still persists, but what relevance does the price movement of the last 18 years have now? In the last three years, a new upward trend has formed, breaking the global descending trend line. Thus, the path further upward is open.
The position of the red and blue lines of the indicator continues to indicate a "bullish" trend. During the last reporting week, the number of long positions in the "Non-commercial" group decreased by 7,100, while the number of short positions fell by 1,300. Accordingly, the net position decreased by 5,800 contracts over the week.
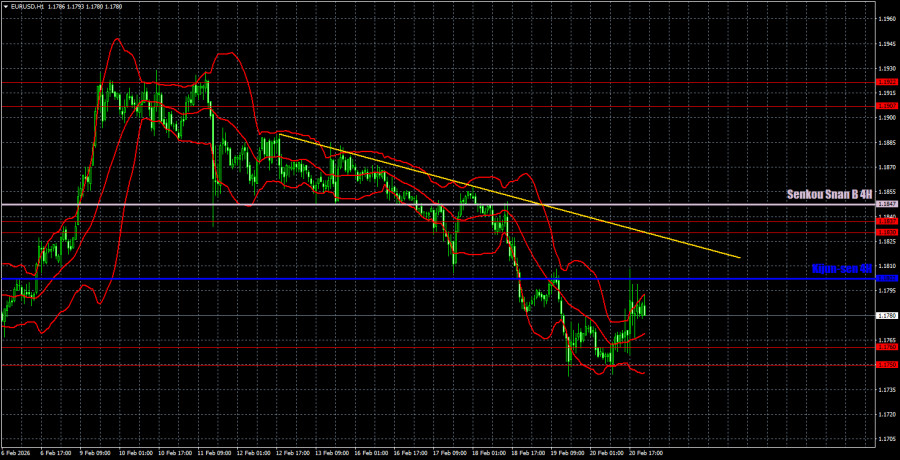
On the hourly timeframe, the EUR/USD pair continues to be positioned below the lines of the Ichimoku indicator, which hinders its ability to continue its upward movement. The pair left the sideways channel of 1.1400-1.1830 at the beginning of the year, where it spent seven months, so the global upward trend has officially resumed. For the technical recovery of the upward trend on the hourly timeframe, a price consolidation above the Senkou Span B line and above the trend line is needed.
On February 23, we highlight the following trading levels—1.1362, 1.1426, 1.1542, 1.1604-1.1615, 1.1657-1.1666, 1.1750-1.1760, 1.1830-1.1837, 1.1907-1.1922, 1.1971-1.1988, 1.2051, 1.2095—along with the Senkou Span B line (1.1847) and the Kijun-sen line (1.1802). The Ichimoku indicator lines may move throughout the day, which should be taken into account when determining trading signals. Don't forget to set a Stop Loss order to break even if the price has moved in the right direction by 15 pips. This will protect against potential losses if the signal turns out to be false.
On Monday, a minor business climate index is scheduled for publication in Germany, while the US calendar is completely empty. However, the market has yet to digest Friday and Saturday's events, so volatility on this day could be sufficiently high.
On Monday, traders may consider selling with a target of 1.1750-1.1760 in case of another rebound from the Kijun-sen line or the trend line. Long positions could be considered with a target of 1.1830-1.1837 in the event of a price rebound from the area of 1.1750-1.1760.

RÁPIDOS ENLACES


 Contáctenos