The GBP/USD currency pair recovered from earlier-week losses, showing signs of strength on Friday. This surge in the British currency was likely driven by optimistic expectations of negotiations between Iran and the US. On Friday, news surfaced that Iranian Foreign Minister Abbas Araqchi had flown to Islamabad for talks, leading traders to believe it was related to negotiations with the US. However, on Saturday morning, Iranian authorities officially ruled out any negotiations with the US at this time. Tehran continues to demand the unblocking of Iranian ports, while Donald Trump rejects this proposal. At the same time, the U.S. president frequently claims he is in contact with certain figures in Iran and regularly receives new proposals, each better than the last, but still unsatisfactory to the US. Recall that Trump previously stated a deal with Iran could be signed soon, yet other American officials have repeatedly stated there has been no progress on key issues.
Thus, as we enter the new week, the British pound may fall as quickly as it rose on Friday. The market could suddenly shift its focus to fundamentals and macroeconomics, as it can't ignore these events forever. However, important reports from the UK were released last week, and the market hardly reacted to them. The Bank of England meeting will take place this week, but no significant decisions are expected. In fact, over the next day, all three central bank meetings will take place, so it follows that volatility could spike significantly. Still, we honestly doubt this.
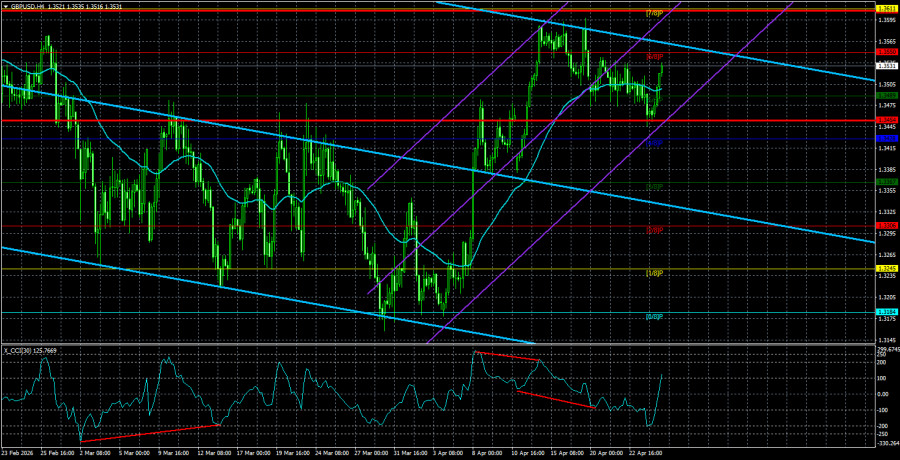
From a technical standpoint, we should pay particular attention to the daily chart. The recent downward correction began after a test of the Senkou Span B line on the daily chart. On Friday, the British pound showed signs of resuming its upward movement, and we are not opposed to a new rise. However, the Senkou Span B line needs to be overcome for growth to be targeted toward this year's peaks.
Recall that even in February and March, we consistently stated that absolutely nothing has changed in the outlook for the U.S. currency. Yes, for two consecutive months, the market actively bought dollars amid geopolitical tensions in the Middle East, using them to safeguard their assets. However, the market has not shown interest in the safe-haven dollar for three weeks now, as the current state of affairs in the Middle East has already been priced in. Thus, in the medium term, we continue to expect only growth for the British currency and a decline for the American one.
On Monday, we expect quite sluggish movements, as no significant events are scheduled for that day, and there were no important geopolitical developments over the weekend.
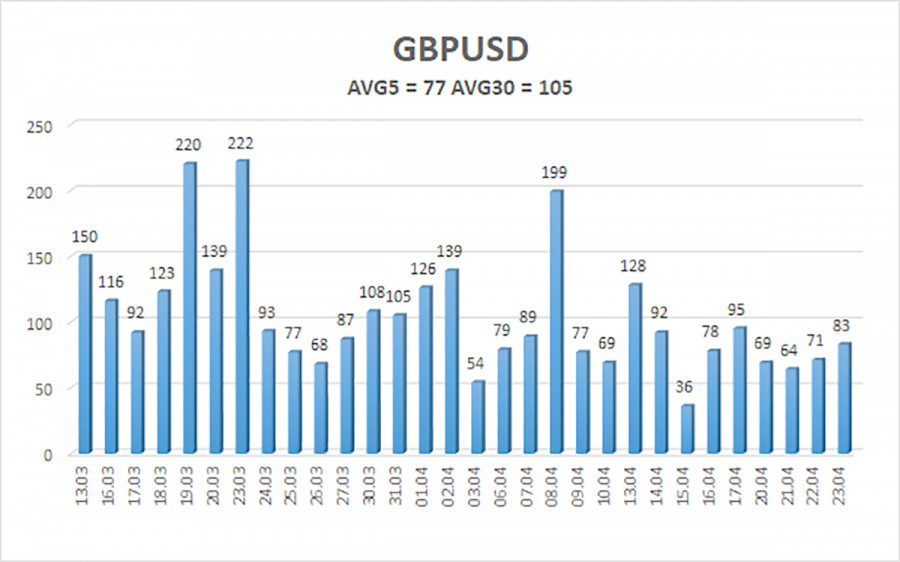
The average volatility of the GBP/USD pair over the last five trading days is 77 pips, which is considered "average" for this currency pair. On Monday, April 27, we expect the pair to trade within a range bounded by 1.3454 and 1.3608. The upper channel of the linear regression is directed downward, indicating a bearish trend. The CCI indicator has entered overbought territory and formed a "bearish" divergence, signaling a potential downward pullback in advance.
The GBP/USD pair continues its recovery after two "months of geopolitics." Donald Trump's policies will continue to put pressure on the U.S. economy, so we do not expect the U.S. dollar to grow in 2026. Thus, long positions with a target of 1.3916 and above remain relevant as long as the price is above the moving average. If the price is below the moving average line, short positions can be considered with targets of 1.3454 and 1.3428 based on technical grounds. In recent weeks, the British currency has recovered, while the geopolitical factor has lost its influence on the market.
Linear regression channels help to define the current trend. If both are directed in the same way, it means the trend is currently strong;
The moving average line (settings 20,0, smoothed) determines the short-term trend and the direction in which trading should currently be conducted;
Murray levels are target levels for movements and corrections;
Volatility levels (red lines) indicate the probable price channel in which the pair will operate over the next day, based on current volatility readings;
The CCI indicator – its entrance into the oversold area (below -250) or the overbought area (above +250) indicates that a trend reversal in the opposite direction may be approaching.

RÁPIDOS ENLACES


 Contáctenos