Společnost JDE Peet’s, která se zabývá výrobou kávy a čaje, v úterý představila novou strategii, jejímž cílem je zjednodušit portfolio a organizační model pod vedením nového generálního ředitele.
Skupina, která prodává kávu, čaj a horkou čokoládu pod více než 50 značkami po celém světě, si klade za cíl dosáhnout čistých úspor produktivity ve výši 500 milionů eur (589 milionů dolarů), z čehož více než polovina má být dosažena do konce roku 2027.
„Naše strategie ‚Reignite the Amazing‘ je založena na značkách a soustředí se na tři velké sázky: Peet’s, L’OR a strategicky vybranou sadu deseti ikonických značek vedených Jacobsem,“ uvedl ve svém prohlášení před investorským dnem společnosti generální ředitel Rafael Oliveira, který tuto funkci převzal na konci roku 2024.
Společnost JDE Peet’s uvedla, že „velké sázky“ byly vybrány kvůli jejich schopnosti uspokojit současné i nové potřeby spotřebitelů a podpořit dlouhodobý růst a relevanci na trhu.
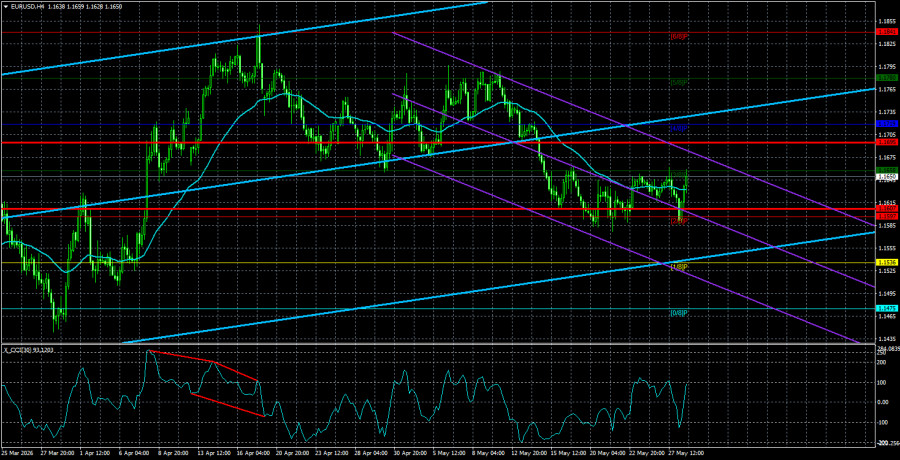
The EUR/USD currency pair remained stagnant on Thursday. The "analysis" should begin not with geopolitical events or macroeconomic reports, but with an indicator that most traders and analysts regularly seem to forget: volatility. It is important to note that when the market is stagnant, no matter what signals form or events occur, one cannot make profits during movements because there are practically none. Therefore, it is always essential to clearly understand the market's current sentiment.
This week, the average daily volatility of the pair is around 45 pips. Thus, even if you opened a position at the lowest point and closed at the highest, considering spreads, commissions, inaccuracies, and entry precision, you would gain no more than 15-20 pips, and that's in the best-case scenario. For example, on Tuesday, the EUR/USD pair demonstrated volatility of only 28 pips; there was no talk of profit at all. It should also be understood that low volatility typically indicates a flat market, meaning that the price randomly changes direction throughout the day. Consequently, numerous signals can be generated, but no actual movements occur. The conclusion? Most signals will turn out to be false.
Now let's look at the news and events from Thursday. We won't focus on macroeconomic data, as the market has been ignoring them for the past 3 months. What about geopolitics? There have also been no changes regarding geopolitical tensions. Sometimes it seems that Iran and the U.S. are engaged in a staged farce, as what is currently happening between the two powers cannot be called a ceasefire, negotiations, or war. On Thursday, Iran and the U.S. again exchanged strikes. And on Tuesday — once more. It makes no sense to analyze who struck first and who responded, as, for instance, Washington labeled the strikes on the Iranian military base on Tuesday as "defensive." This implies that strikes can be made against an enemy for the sake of defense. So what is the meaning and essence of a ceasefire?
The market responded again to the escalation in the Persian Gulf by buying the dollar. However, the EUR/USD pair could not drop significantly below the support area of 1.1583-1.1597. Thus, a sort of "floor" has formed, and to move lower, something more significant than yet another exchange of strikes, accompanied by talk of a ceasefire and a deal, is required. Incidentally, discussions in Tehran about negotiations and any agreements are becoming increasingly rare. One cannot deny Iran's transparency in its position. Donald Trump has verbally destroyed Iran ten times, claimed to have eliminated its entire nuclear stockpile, fleet, and military potential five times, and "signed" an agreement eight times. In reality, none of this has materialized.
Iran takes a different position. It still insists on its list of demands and does not make empty, false statements: negotiations are underway, but the parties are far apart; the conflict persists; there are no agreements.
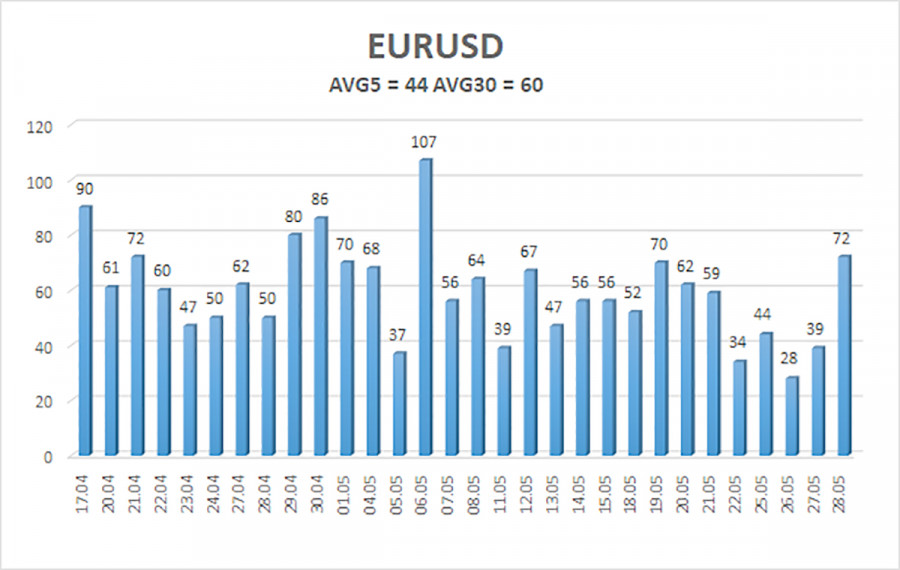
The average volatility of the EUR/USD pair over the last 5 trading days, as of May 29, is 44 pips and is characterized as "low." We expect the pair to move between levels 1.1607 and 1.1695 on Friday. The upper linear regression channel has turned upward, indicating a shift to a bullish trend. In fact, the bullish trend of 2025 could have resumed as early as March. The CCI indicator has entered the overbought area and formed two "bearish" divergences, signaling the start of a downward correction that is still underway.
The EUR/USD pair continues its downward movement, which is presumed to be a correction within the broader global upward trend. The global fundamental background for the dollar remains extremely negative, with geopolitical factors regularly supporting it. If the price is below the moving average, short positions can be considered with targets of 1.1597 and 1.1536. Long positions are viable above the moving average line with targets of 1.1780 and 1.1841. The market has been moving away from geopolitical factors, but in recent weeks, the dollar has been in demand as market hopes for peace in the Middle East have weakened.

RÁPIDOS ENLACES



















 Contáctenos