The EUR/USD currency pair fell to the 1.1615-1.1625 area on Monday, showing a decent decline, but overall, the technical picture has not changed at all, as indicated by the hourly timeframe. Essentially, the pair continues to move sideways with a minimal upward slope. The price has failed to consolidate above the Senkou Span B line, therefore the downward trend is formally maintained. On Monday, the macroeconomic backdrop supported the decline of the European currency, though there was little confidence that the market would react to the economic data. In the morning, the Eurozone unemployment rate was released, and traders expected it to decrease to 6.2%. However, the actual figure remained at 6.3%. In the US session, the ISM Manufacturing Index was released, showing a value above the forecast—54 points versus 53. Thus, both reports supported the US dollar. But again, fundamentally, nothing has changed for the EUR/USD pair.
From a technical perspective, the downward trend persists, and the price has not managed to overcome the Senkou Span B line. For almost three weeks, we have witnessed practically sideways movement after a strong decline, signaling the weakness of the bulls. However, bears are also hesitant to open new positions as geopolitical uncertainty continues to be high.
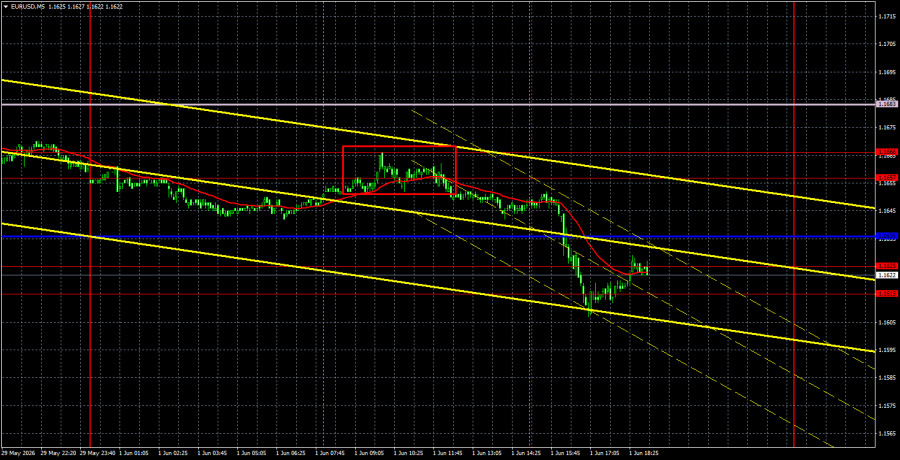
On the 5-minute timeframe, one trading signal was formed on Monday. During the European trading session, the price bounced from the area of 1.1657-1.1666, but we would not recommend trading this signal as the nearest target—the Kijun-sen line—was only 20 pips away.
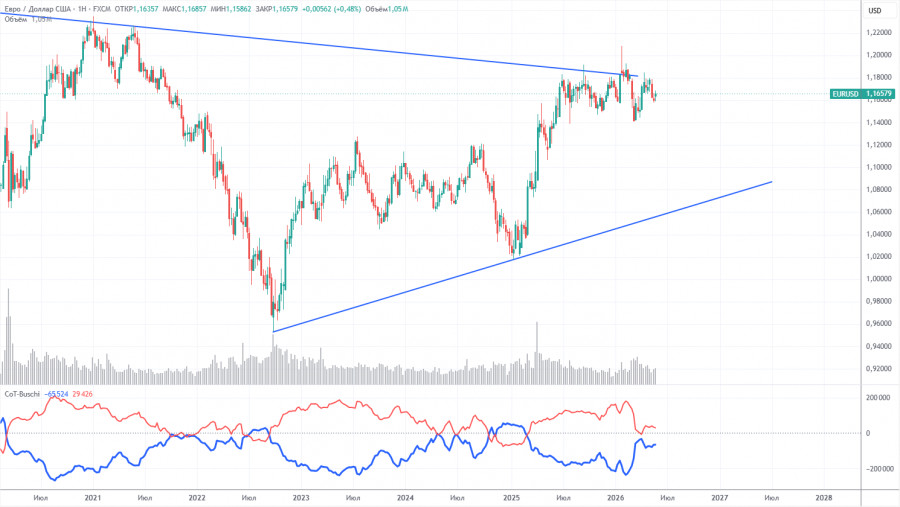
The latest COT report is dated May 26. The weekly timeframe illustration clearly shows that the net position of non-commercial traders remains "bullish," but is rapidly declining due to geopolitical events. Traders have been shedding the European currency in favor of the US dollar in recent months. Trump's policies have not changed, but for some time, the dollar has served as a "reserve currency." However, this process may have already ended.
We still see no fundamental factors supporting the strengthening of the European currency, while sufficient factors for the decline of the American currency remain. The war in the Middle East rendered the dollar temporarily super attractive, but when this factor expires, everything will revert. And that expiration could be near. In the long term, the euro could fall to the level of $1.06 (the trend line), but the upward trend will still be relevant. Currently, the pair has not deviated significantly from the descending trend line, which has been broken multiple times.
The positioning of the red and blue lines of the indicator indicates parity between the bulls and bears. During the last reporting week, the number of longs for the "Non-commercial" group decreased by 10,200, while the number of shorts decreased by 6,100. Consequently, the net position fell by a total of 4,100 contracts during the week.
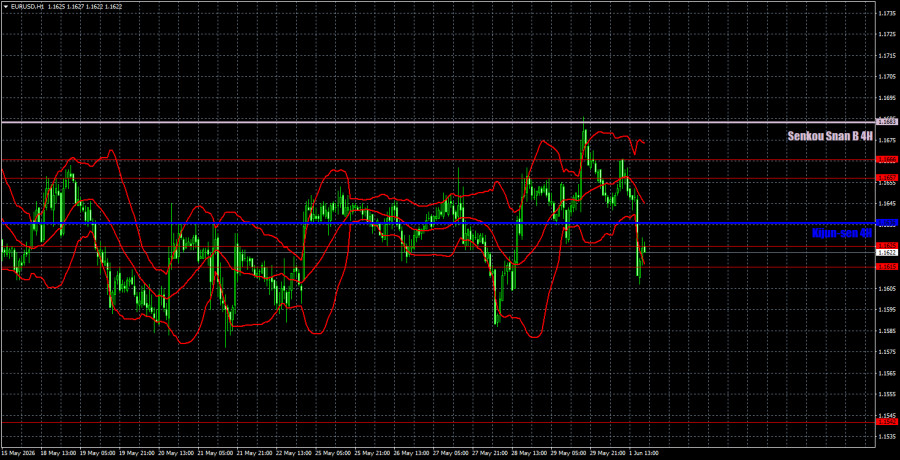
On the hourly timeframe, the EUR/USD pair continues to form a downward trend and remains generally flat. The situation in the Middle East remains tense, not getting worse, and Washington and Tehran may only dream of signing a preliminary agreement. If no new signs of escalation in the Middle East emerge and the memorandum is actually signed, the dollar will begin to lose positions. But for now, we see neither of these scenarios.
On June 2, we highlight the following levels for trading: 1.1362, 1.1426, 1.1542, 1.1585, 1.1615-1.1625, 1.1657-1.1666, 1.1750-1.1760, 1.1786, 1.1830-1.1837, 1.1907-1.1922, as well as the lines of Senkou Span B (1.1683) and Kijun-sen (1.1636). The Ichimoku indicator lines may move throughout the day, which should be taken into account when determining trading signals. Don't forget to set a Stop Loss order to break even if the price moves in the correct direction by 15 pips. This will protect against potential losses if the signal turns out to be false.
On Tuesday, an important inflation report will be published in the Eurozone, while in the US, a JOLTS report on job openings will be released. We do not expect a significant reaction to the JOLTs report, but European inflation could have a considerable impact as it directly influences the European Central Bank's sentiment.
Today, traders can open short positions targeting 1.1585 and 1.1542 if the price consolidates below the 1.1615-1.1625 area. Long positions can be opened in the event of a bounce from the 1.1615-1.1625 area, targeting the area of 1.1657-1.1666 and the Senkou Span B line.
Price levels of support and resistance – thick red lines where movement may stop. They are not sources of trading signals.
Kijun-sen and Senkou Span B lines – Ichimoku indicator lines transferred from the 4-hour timeframe to the hourly timeframe. They are strong lines.
Extreme levels – thin red lines where the price previously bounced. They are sources of trading signals.
Yellow lines – trend lines, trend channels, and any other technical patterns.
Indicator 1 on COT charts – the size of the net position for each category of traders.

RÁPIDOS ENLACES


 Contáctenos