Trend Analysis
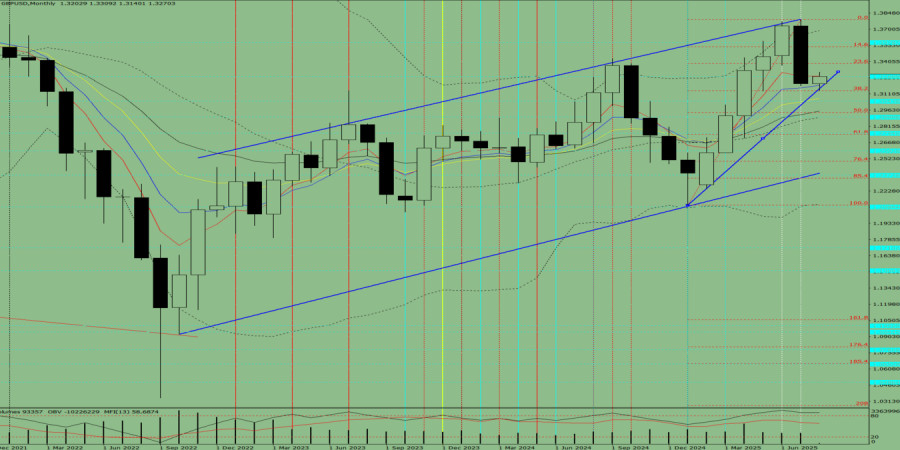
In August, the price from the level of 1.3203 (closing of the July monthly candle) may begin to move upward toward the target of 1.3539 – the 14.6% retracement level (red dashed line). Upon testing this level, the price may pull back downward toward the 23.6% retracement level at 1.3386 (red dashed line).
Fig. 1 (Monthly Chart)
Indicator Analysis:
Conclusion based on comprehensive analysis: a potential upward trend.
General forecast for the GBP/USD monthly candle: The price is likely to show an upward trend, with no lower shadow on the monthly white candle (first week of the month – bullish), and an upper shadow (last week of the month – bearish).
Alternative Scenario: From the level of 1.3203 (closing of the July monthly candle), the price may begin to move upward toward the target of 1.3789 – upper fractal (red dashed line). Upon testing this level, the price may pull back downward toward 1.3591 – historical resistance level (blue dashed line).

HIZLI BAĞLANTILAR
show error
Unable to load the requested language file: language/turkish/cookies_lang.php
date: 2025-08-05 03:22:06 IP: 216.73.216.179


 Bize Ulaşın

