S&P 500
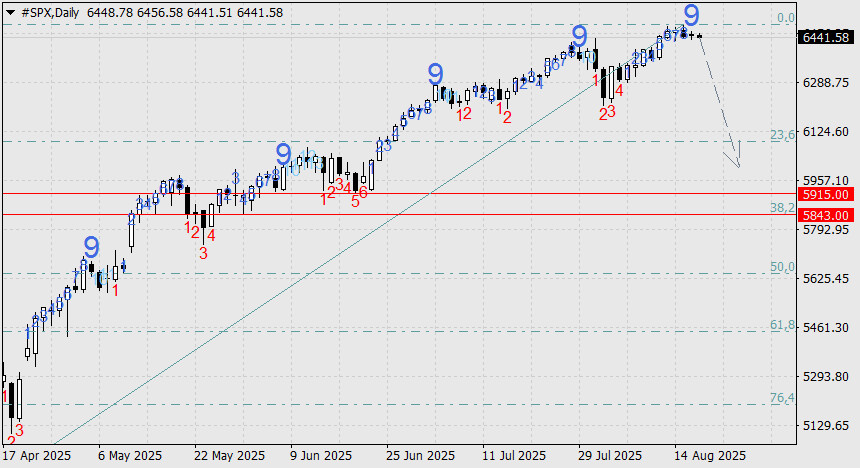
On the daily chart of the S&P 500 index, a reversal "nine" has formed for the fifth time in a row according to the Sequential indicator (T. DeMark). The last time we saw four consecutive "nines" was in early September 2021, which later led to a 6.0% decline in the index.
Five "nines" could result in an even deeper decline. For example, a drop of 8.5% would bring the price to the June support level of 5915. A drop of 9.6% would take the price to the strong support area of November 2024 – January 2025 at 5843. This level would also coincide with the 38.2% retracement from the entire rally that started on April 8.
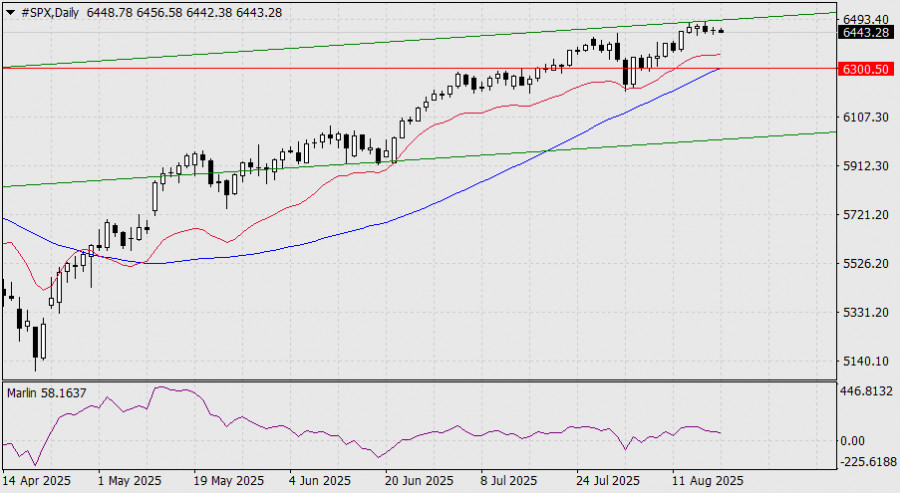
Linear indicators point to the MACD line (6300) as the confirming reversal level. It also coincides with the resistance of July 15.
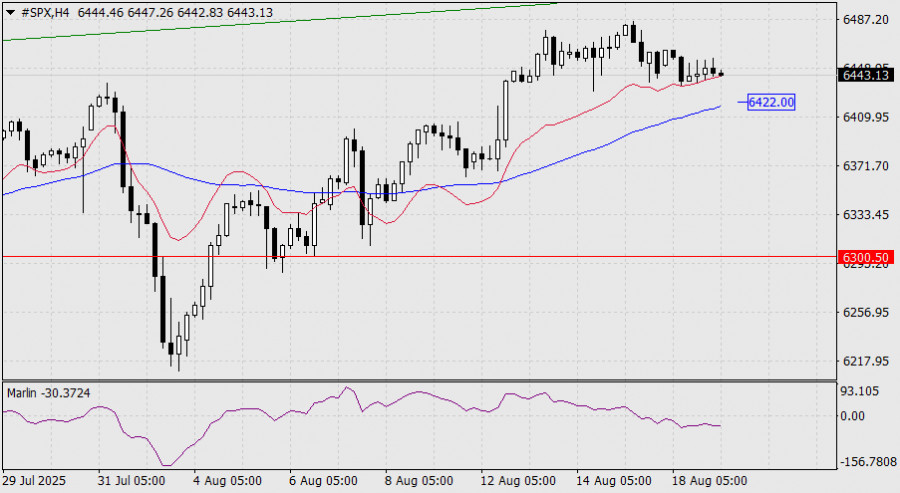
The first signal will be the price breaking below the MACD line on the four-hour chart (6422).

HIZLI BAĞLANTILAR
show error
Unable to load the requested language file: language/turkish/cookies_lang.php
date: 2025-08-19 09:13:21 IP: 216.73.216.15


 Bize Ulaşın

