Piyasa güncellemeleri ve tahminleri

Forexmart'ın Piyasa Analizi bölümü finans piyasası hakkında güncel bilgiler sağlar. Genel bakışlar size güncel trendler, finansal tahminler, küresel ekonomik raporlar ve piyasayı etkileyen siyasi haberler hakkında fikir verme amaçlıdır. Market.

Disclaimer:  ForexMart yatırım tavsiyesi sunmaz ve sağlanan analizler gelecekteki sonuçların vaadi olarak yorumlanmamalıdır.

EUR/USD. Indicator Analysis on August 19, 2025
03:45 2025-08-19 UTC--5
Döviz Kurları analizi

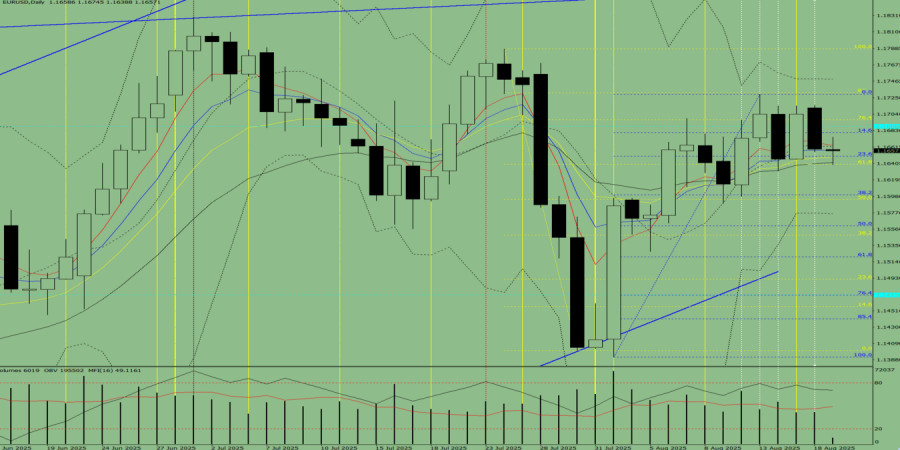
Trend Analysis (Fig. 1).

On Tuesday, from the 1.1659 level (the closing price of yesterday's daily candle), the market may continue moving downward toward 1.1581 – the 38.2% retracement level (blue dashed line). Upon testing this level, the price may rebound upward, aiming to test the lower fractal at 1.1631 (daily candle of August 14, 2025).

Fig. 1 (Daily Chart).

Comprehensive Analysis:

  • Indicator analysis – downward;
  • Volumes – downward;
  • Candlestick analysis – downward;
  • Trend analysis – downward;
  • Bollinger Bands – downward;
  • Weekly chart – downward.

Overall conclusion: bearish trend.

Alternative scenario: From the 1.1658 level (closing price of yesterday's daily candle), the price may continue moving downward toward 1.1640 – the 61.8% retracement level (yellow dashed line). Upon testing this level, the price may rebound upward, aiming to test the 23.6% retracement level at 1.1650 (blue dashed line).


Geri Bildirim

ForexMart is authorized and regulated in various jurisdictions.

(Reg No.23071, IBC 2015) with a registered office at First Floor, SVG Teachers Co-operative Credit Union Limited Uptown Building, Corner of James and Middle Street, Kingstown, Saint Vincent and the Grenadines

Restricted Regions: the United States of America, North Korea, Sudan, Syria and some other regions.


© 2015-2025 Tradomart SV Ltd.
Top Top

show error

Unable to load the requested language file: language/turkish/cookies_lang.php

date: 2025-08-20 03:59:36 IP: 216.73.216.15