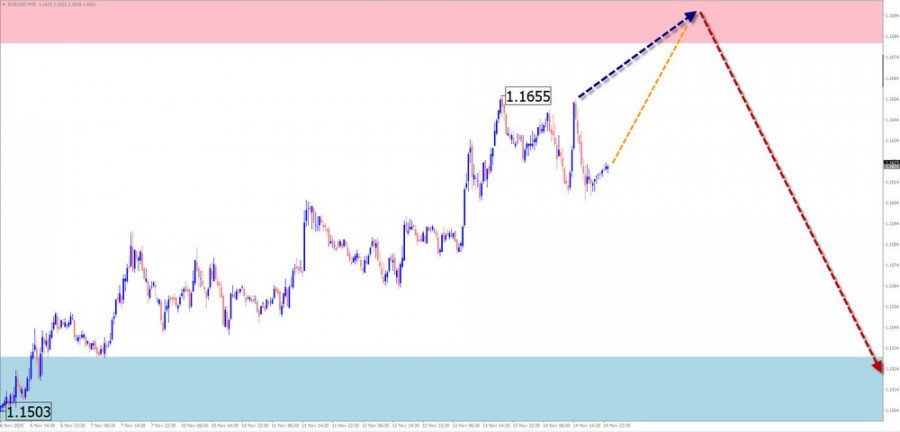
EUR/USD
Analysis:
In the short term, the relevant wave structure is downward. For the main trend, this is a correction. It has been developing since mid-September and is still not complete. The structure at the time of analysis does not appear finished. Its middle part (B) is forming. The price is approaching the lower boundary of the potential reversal zone, but no signals of an imminent reversal are observed.
Forecast:
During the upcoming week, the euro is expected to trade mostly sideways. In the next couple of days a rise is possible with brief pressure on the resistance zone. Afterwards, a reversal and decline are likely, down to the lower boundary of support. Increased volatility may occur in the second half of the week.
Potential Reversal Zones
Resistance:
Support:
Recommendations:
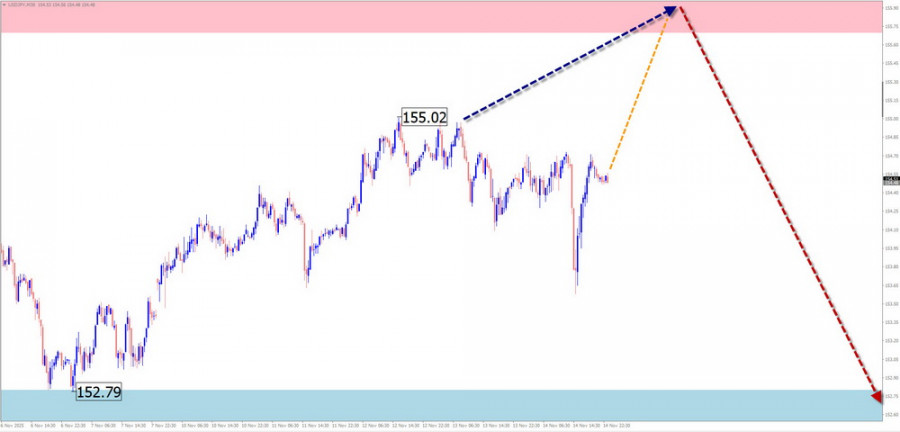
USD/JPY
Analysis:
The trend toward weakening of the Japanese yen against the US dollar in the short term has been visible since April of this year. Quotes of the yen's major pair have reached the upper boundary of a strong weekly-TF potential reversal zone. The unfinished segment of the wave is corrective, taking the form of an extended flat. It has been forming since early October.
Forecast:
At the beginning of the week, continued price growth is most likely, followed by sideways movement along the resistance zone. Afterwards, a reversal and the start of a price decline can be expected. The calculated support limits the weekly downward range.
Potential Reversal Zones
Resistance:
Support:
Recommendations:
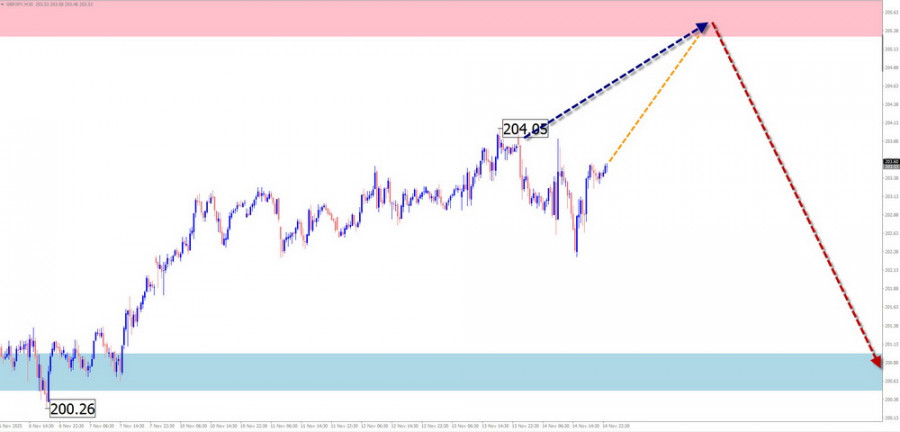
GBP/JPY
Analysis:
In recent months, the short-term scale of the British pound/Japanese yen pair shows a dominant upward trend. The unfinished wave segment began on August 4. Over the past three weeks, quotes have formed a corrective part (B) as a horizontal flat. This wave segment does not yet appear complete.
Forecast:
In the first days of the upcoming week, movement is likely to be mainly sideways with an upward bias. Upward movement may reach the upper boundary of resistance. In the second half of the week, a reversal may occur, beginning a decline in the pair rate. The decrease may continue to the support levels.
Potential Reversal Zones
Resistance:
Support:
Recommendations:
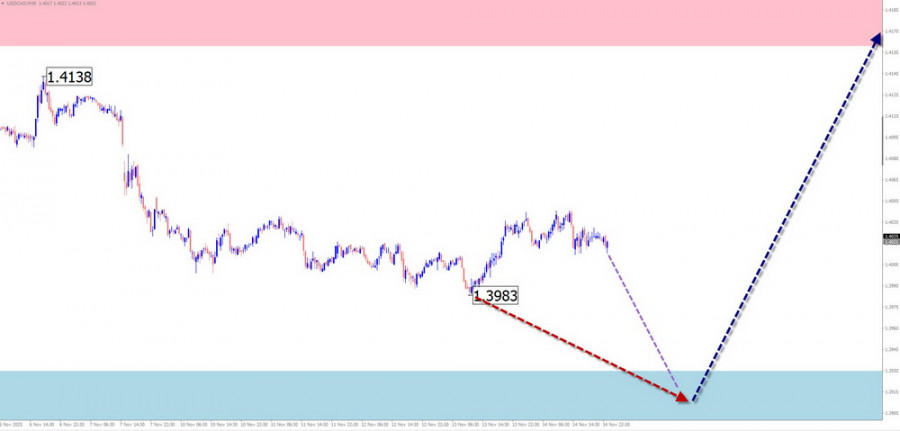
USD/CAD
Analysis:
The main Canadian dollar pair continues developing the downward wave that started in February. The counter-wave structure from June 16 does not have reversal potential and remains a correction. This wave segment is not yet complete. The calculated resistance coincides with the potential reversal zone on the daily timeframe.
Forecast:
In the next couple of days, movement is likely sideways with a downward tilt. Near the support zone, a pause and conditions for a trend change may form. A reversal is expected closer to the weekend. The calculated levels indicate the expected weekly range for the pair.
Potential Reversal Zones
Resistance:
Support:
Recommendations:
NZD/USD
Analysis:
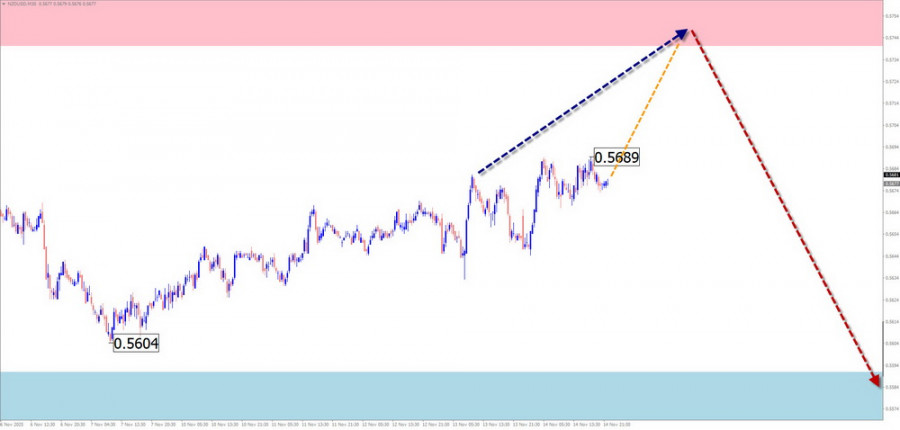
Since early April, the New Zealand dollar's main pair has been forming an upward wave structure in the form of an extended flat. At the moment, the middle part (B) is forming. It is not yet complete. The price has reached the upper boundary of a broad weekly potential reversal zone.
Weekly Forecast:
A generally flat movement can be expected throughout the week. In the first days, an upward vector is possible. Completion of the rise and a subsequent reversal are most likely within the calculated resistance zone. During the reversal, volatility may rise with a brief spike above the reversal zone.
Potential Reversal Zones
Resistance:
Support:
Recommendations:
EUR/GBP
Analysis:
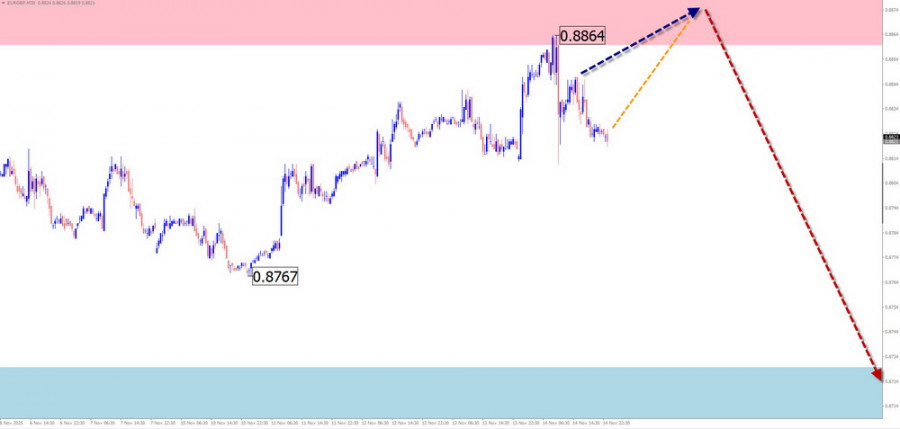
The unfinished wave structure of the euro/pound pair has been developing downward since April 11. The wave forms a contracting flat. For the past six months, price has been forming the middle part (B). Quotes have reached the lower boundary of the weekly potential reversal zone.
Weekly Forecast:
In the next couple of days, sideways movement is likely. A direct breakout of the resistance zone is unlikely. By the end of the week, rising volatility may trigger a reversal and the start of price decline. The calculated support shows the lower boundary of the expected weekly range.
Potential Reversal Zones
Resistance:
Support:
Recommendations:
Gold
Analysis:
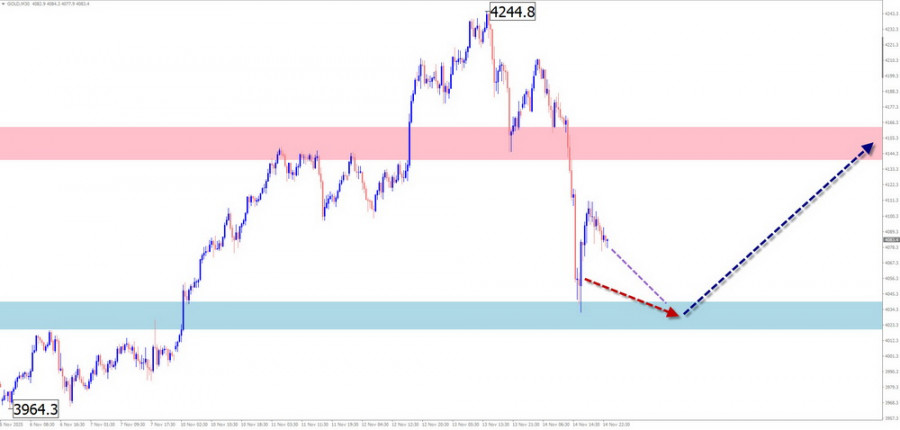
The current short-term wave structure is a downward wave from October 17. Over the past three weeks, the corrective part (B) has been forming along a strong resistance zone. The wave is an extended horizontal flat and is not yet complete.
Forecast:
In the next few days, the downward vector of gold is expected to complete. Near the support zone, sideways movement may form along with conditions for a reversal. A resumption of price growth is likely by the end of the week. The calculated resistance shows the upper boundary of the expected weekly range.
Potential Reversal Zones
Resistance:
Support:
Recommendations:
Bitcoin
Analysis:
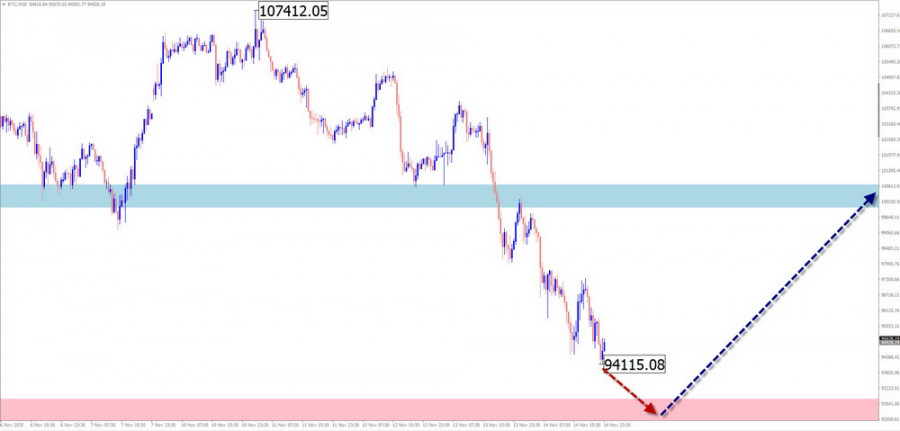
The unfinished bearish wave structure on the Bitcoin chart has been forming since mid-July. Its wave degree has reached the scale of a full correction of the entire uptrend that started at the end of 2022. Quotes have reached the lower boundary of the weekly potential reversal zone. No reversal signals are present yet.
Weekly Forecast:
In the next couple of days, price may continue to decline toward calculated support. A breakout below it is unlikely on the first attempt. By the end of the week, increased volatility may lead to a reversal and renewed price growth. The calculated resistance shows the upper boundary of the expected weekly range.
Potential Reversal Zones
Resistance:
Support:
Recommendations:
Notes:
In Simplified Wave Analysis (SWA), all waves consist of three parts (A-B-C). On each timeframe, only the last unfinished wave is analyzed. Dashed lines show expected movements.
Important: The wave algorithm does not account for the duration of movements in time!

HIZLI BAĞLANTILAR
show error
Unable to load the requested language file: language/turkish/cookies_lang.php
date: 2025-11-17 10:05:10 IP: 216.73.216.141


 Bize Ulaşın

