Chilská těžařská společnost Antofagasta (LON:ANTO) vidí příležitost pro svůj zastavený projekt těžby mědi v USA po rozhodnutí prezidenta Donalda Trumpa uvalit 50% cla na dovoz tohoto kovu, uvedl ve čtvrtek generální ředitel Ivan Arriagada.
Společnost Antofagasta, kótovaná na londýnské burze, provozuje čtyři měděné doly v Chile a zamýšlí rozvíjet měděný a niklový důl Twin Metals v Minnesotě. Projekt se zastavil poté, co administrativa bývalého prezidenta Joea Bidena zablokovala povolení z důvodu obav o životní prostředí.
„Máme projekt a v této situaci vidíme příležitost k jeho rozvoji,“ řekl Arriagada novinářům na jedné akci.
Uvedl, že konečné rozhodnutí o investici do projektu bude trvat ještě roky.
„Musíme pokračovat v práci s dlouhodobou perspektivou.“
Těžařská společnost zachovala své současné střednědobé a dlouhodobé prodejní smlouvy bez dodatečných dodávek mědi do USA, dodal.
Americké společnosti nakupují měď ve velkém od února, kdy Trump zahájil vyšetřování možného zavedení cel na dovoz mědi.
Chile je největším producentem mědi na světě a také největším dovozcem mědi do USA.
Chilská ministryně těžby Aurora Williamsová, která hovořila po boku Arriagady, uvedla, že vláda dosud neobdržela přesné informace o tom, jak budou cla na měď zavedena ani které druhy mědi budou postiženy.
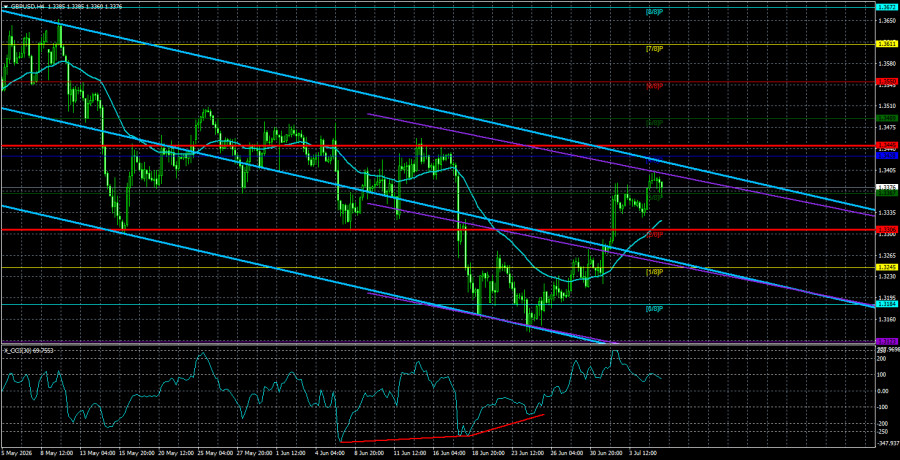
The GBP/USD currency pair showed minimal volatility on Tuesday, with no grounds for strong movement. Nevertheless, the British currency has been rising for a full two weeks, despite the absence of local justifications for this growth. However, the rise of the British currency is both logical and fair for several reasons.
The dollar trend has lasted for two months. The conflict in the Middle East is over, the Federal Reserve has not even begun raising the key rate due to high inflation (and may not start at all), and the political crisis in the UK was fabricated by journalists and analysts who needed to explain the recent drop in the British currency somehow. It's worth noting that the UK has seen seven prime ministers change in the last ten years, along with several dozen ministers. Therefore, the resignation of another high-ranking official is no longer a crisis for the United Kingdom but rather a routine reshuffle. Thus, the recent downturn in the pair (after the Fed meeting) was entirely unnecessary and unjust. What we are witnessing now is merely a "restoration of fairness." The market has brought the GBP/USD exchange rate to a more or less adequate level given the current circumstances.
We expect further growth from the British currency, as the daily and weekly timeframes clearly show a flat that has lasted nearly a year. When dealing with a sideways trend, movements within it are random. Simply put, the market is currently accumulating or reallocating long-term positions in anticipation of a new powerful movement. Yes, this process has undeniably dragged on, but flat periods can occur on higher timeframes as well, so we are left to wait or trade within the sideways channel of 1.3150-1.3780.
Since the last time, the price has fallen to the lower boundary of the channel, and we anticipate a move toward the upper boundary. It's important to note that despite the absence of a dollar decline over the past year, the American currency has yet to show a significant correction (in the long term). It has simply gone a year without a new drop, yet we believe the upward trend in the GBP/USD pair will resume sooner or later, unless Donald Trump starts a new war.
What could support the British pound in the near term? From our perspective, it could be a sharp easing of the Fed's monetary stance or a tightening of the Bank of England's monetary outlook. Inflation in the UK is expected to rise in the second half of the year; thus, if consumer prices rise significantly, the British central bank could raise rates once or twice. This assistance would certainly be beneficial for the pound sterling. Regarding the Fed, a softening of the hawkish stance is possible if inflation in the U.S. starts to slow down in the near term. The next inflation report is scheduled for next Tuesday, when we will find out if there are real grounds to expect the Fed to abandon its hawkish plans.
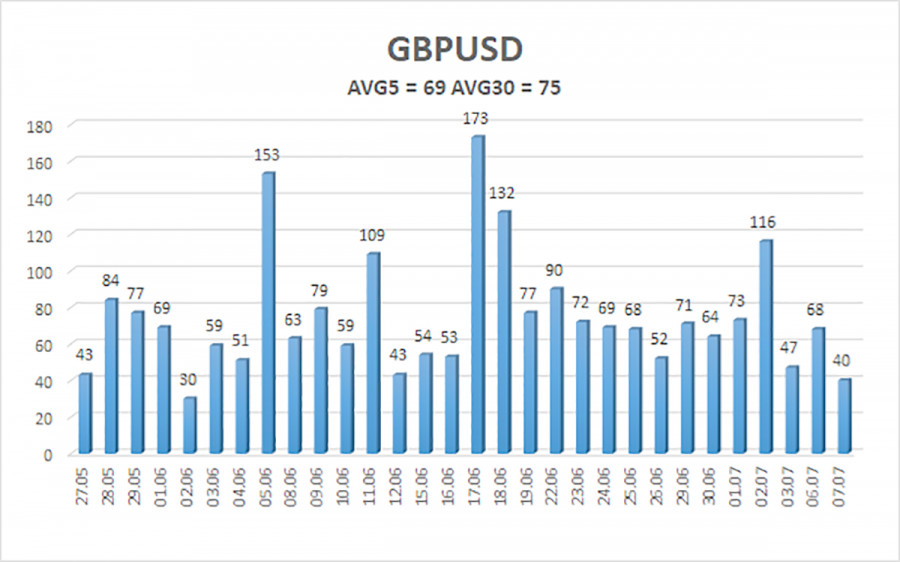
The average volatility of the GBP/USD pair over the last five trading days is 69 pips, which is considered "average" for this currency pair. On Wednesday, July 8, we expect the pair to move within a range bounded by 1.3307 and 1.3445. The upper channel of the linear regression is directed downward, indicating a bearish trend. The CCI indicator has entered the oversold area twice and formed two "bullish" divergences, warning of a possible end to the downward trend.
The GBP/USD currency pair maintains a downward trend. Donald Trump's policies will continue to exert pressure on the U.S. economy, so we do not expect long-term growth in the U.S. dollar. While 2026 appears quite positive for the dollar due to geopolitical factors and the Fed's readiness to raise the key rate, a sideways range remains on the weekly timeframe between 1.3150 and 1.3780, within the context of a four-year upward trend. Long positions can be considered with target levels of 1.3428 and 1.3489 when the price is above the moving average. Conversely, if the price is below the moving average, short positions can be considered targeting 1.3245.
HIZLI BAĞLANTILAR
show error
Unable to load the requested language file: language/turkish/cookies_lang.php
date: 2026-07-08 09:30:20 IP: 172.18.0.1
















 Bize Ulaşın