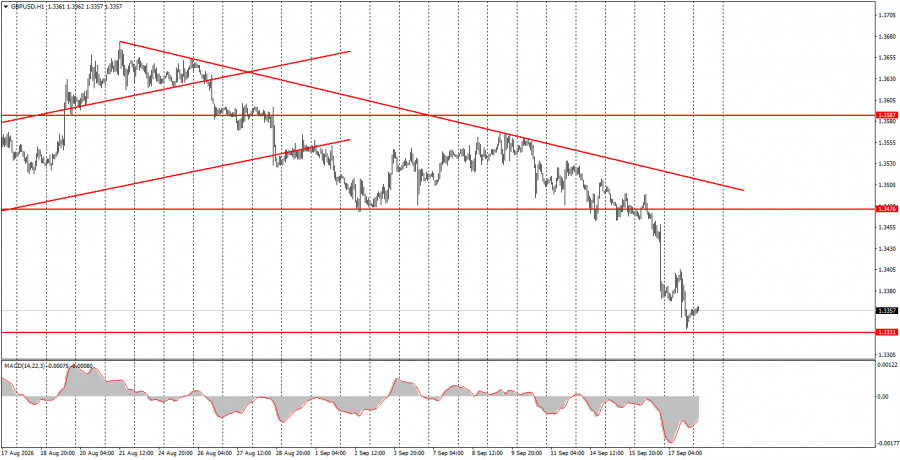
The GBP/USD pair calmly continued its downward move on Thursday. This time the pound's decline was triggered by completely neutral results from the Bank of England meeting. The BoE did not decide to tighten policy, but no trader expected it to. The Bank of England's Monetary Policy Committee voted three in favor of a hike and six to hold the rate, as expected. So why did sterling fall again? Because it has been falling for a week on a single factor — the Federal Reserve's monetary-policy stance — which the market has been repricing already for the third or fourth time. No other factors are driving dollar strength. The downtrend on the hourly timeframe persists, as evidenced by the trend line. With such a one-sided market mood, the US currency can continue to rise as long as it persists.
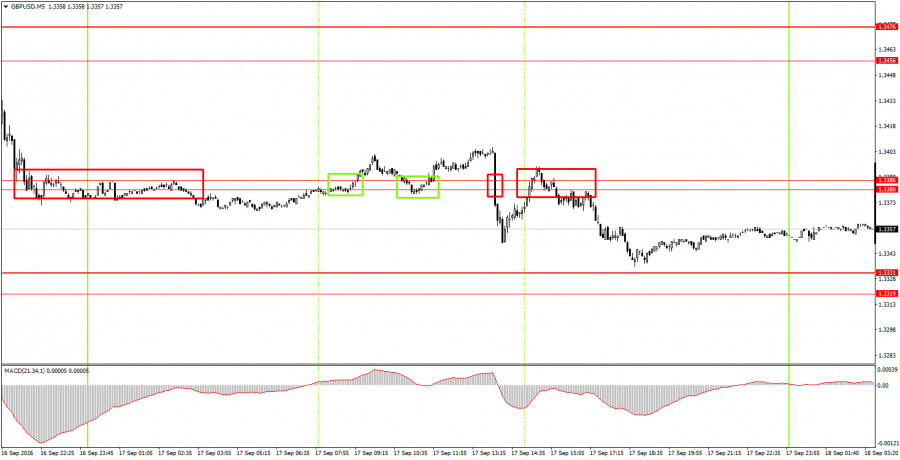
On the 5-minute timeframe on Thursday, four trading signals were formed — each worse than the last. During the European session, price bounced twice from the 1.3380–1.3386 area but failed to gain even 20 pips on either attempt. Then sterling plunged after the BoE meeting and the price produced two sell signals in the same zone. Only on the fourth attempt did the pair move more than 20 pips in the intended direction.
On the hourly timeframe, GBP/USD continues a downward trend that is turning into a full-blown trend. The fundamental backdrop for the dollar and the pound changed sharply on Wednesday evening as the Fed signaled it is ready to continue tightening. As a result, dollar positioning for 2026 has become materially more favorable again. However, the dollar has no other supporting factors.
On Friday, novice traders may consider short positions targeting 1.3319–1.3331 on a rejection from the 1.3380–1.3386 area. Open long positions targeting 1.3456–1.3476 if price confirms a close above the 1.3380–1.3386 zone.
On the 5-minute timeframe, you can trade the levels 1.3259–1.3267, 1.3319–1.3331, 1.3380–1.3386, 1.3456–1.3476, 1.3587–1.3598, 1.3631–1.3641, 1.3695, 1.3741. On Friday, the UK will publish retail-sales data, and the US will report industrial-production volumes. We view both releases as secondary, especially after such a busy week.
Price levels (areas) of support and resistance serve as targets for opening buy or sell trades or as sources of signals.
Red lines indicate channels or trend lines that show the current trend and the preferred trading direction.
The MACD indicator (14,22,3) — the histogram and signal line — is an auxiliary indicator that can also provide signals.
Important speeches and reports (listed in the news calendar) can significantly influence currency pair movements. Therefore, during their release, traders should approach trading with utmost caution, or exit the market to avoid sudden reversals against the preceding move.
Beginner forex traders should remember that not every trade can be profitable. Developing a clear strategy and practicing money management are key to long-term success in trading.

HIZLI BAĞLANTILAR
show error
Unable to load the requested language file: language/turkish/cookies_lang.php
date: 2026-09-18 09:02:30 IP: 172.18.0.1

















 Bize Ulaşın