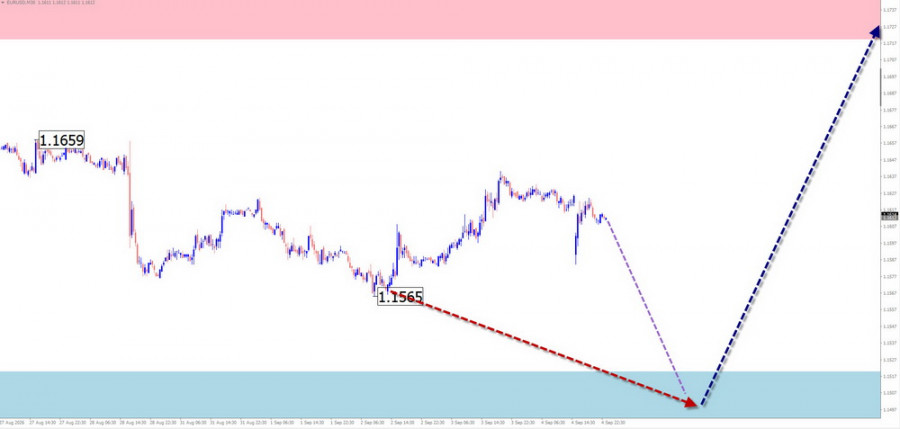
EUR/USD
Brief analysis:
Analysis of the 4-hour chart of the euro major shows that the trend since the end of January this year has been driven by a downward wave. Over the past six months, a counter-trend correction in the form of a running flat has been developing on the chart and is not yet complete. The price is moving along the lower boundary of a strong potential reversal zone.
Weekly forecast:
In the coming days, the sideways movement of the European currency is likely to continue, with an overall downward bias. A pause, reversal, and subsequent rise in the exchange rate should be expected near the support zone. The resistance levels indicate the upper boundary of the pair's expected weekly range.
Potential reversal zones
Resistance:
Support:
Recommendations
Buying: Will become possible after confirmed reversal signals appear near the support zone.
Selling: May be used with reduced position sizes on an intraday basis.
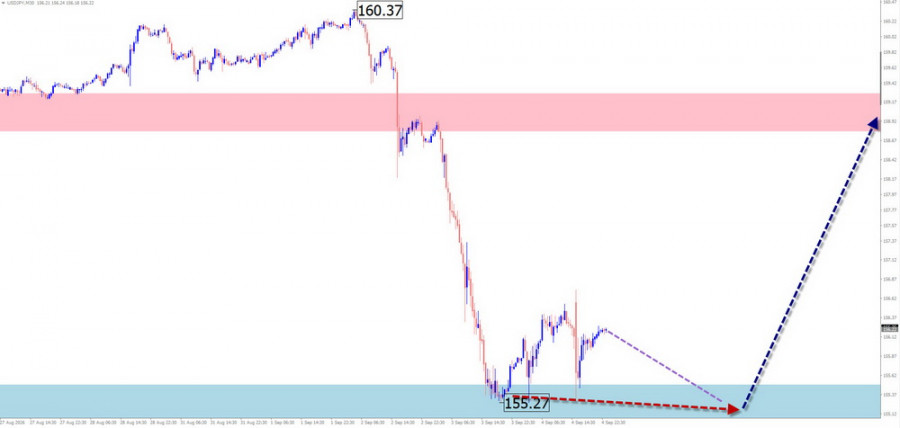
USD/JPY
Brief analysis:
The current upward wave structure of the Japanese yen major, which began on August 3, is forming the beginning of a short-term trend. Its wave degree has reversal potential. Last week, the middle section of the developing wave was completed. The price is moving along the upper boundary of a strong potential reversal zone.
Weekly forecast:
In the coming days, sideways movement is expected, with the price moving along the support zone. A break below its lower boundary is unlikely. The second half of the week is expected to be more volatile. Closer to the weekend, a change in direction and a resumption of the price rise can be expected, potentially reaching the calculated support levels.
Potential reversal zones
Resistance:
Support:
Recommendations
Selling: Risky and has limited potential.
Buying: May become profitable after confirmed reversal signals appear near the reversal zone.
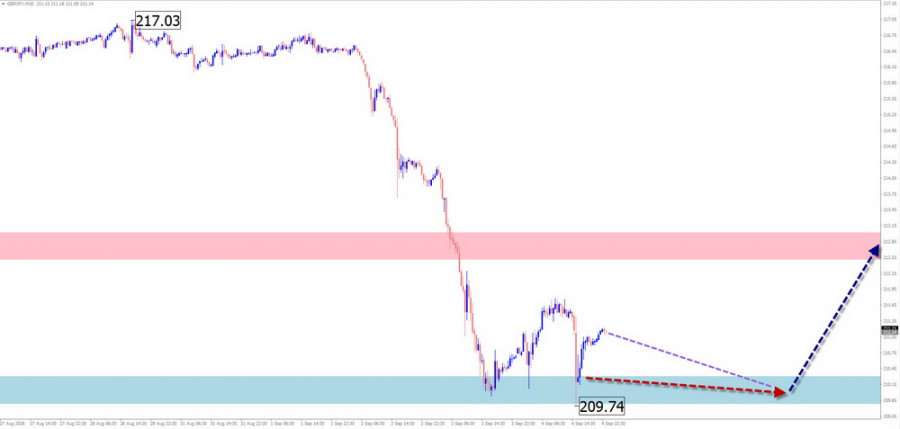
GBP/JPY
Brief analysis:
On the short-term H1 chart of the British pound/Japanese yen pair, an uptrend has been developing over the past month. Following last week's corrective decline from the upper boundary of a strong potential reversal zone, an upward segment with reversal potential is developing. Once confirmed by a corrective segment, the direction of price movement will change to upward.
Weekly forecast:
At the beginning of the week, the overall sideways movement is likely to continue, with the price moving along the support zone. Closer to the weekend, the probability of increased volatility and a change in direction toward a bullish move will rise. A brief move below the lower boundary of the zone cannot be ruled out. The reversal may coincide with the release of important economic data.
Potential reversal zones
Resistance:
Support:
Recommendations
Selling: Carries a high degree of risk and may result in losses.
Buying: May be considered after reversal signals appear near the calculated support zone.
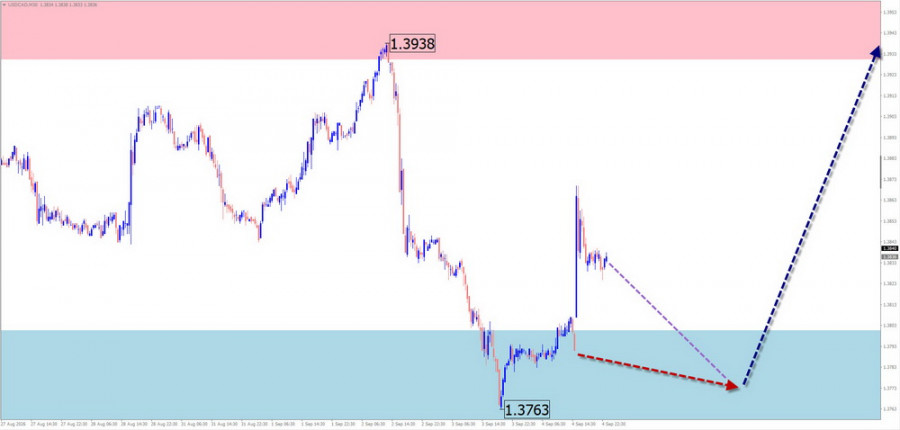
USD/CAD
Brief analysis:
The Canadian dollar against the US currency has continued to move downward over the past six months. Over the past month, the price has been forming a flat corrective segment. The wave structure is missing its final segment.
Weekly forecast:
At the beginning of the coming week, sideways movement can be expected. A decline is possible, but no further than the boundaries of the calculated support zone. After that, a change in direction can be expected in this zone, followed by a rise toward the resistance zone. The highest volatility is expected closer to the weekend.
Potential reversal zones
Resistance:
Support:
Recommendations
Selling: Has limited potential. Trades may be profitable on an intraday basis using reduced position sizes.
Buying: There are no conditions for buying until confirmed reversal signals appear near the support zone.
NZD/USD
Brief analysis:
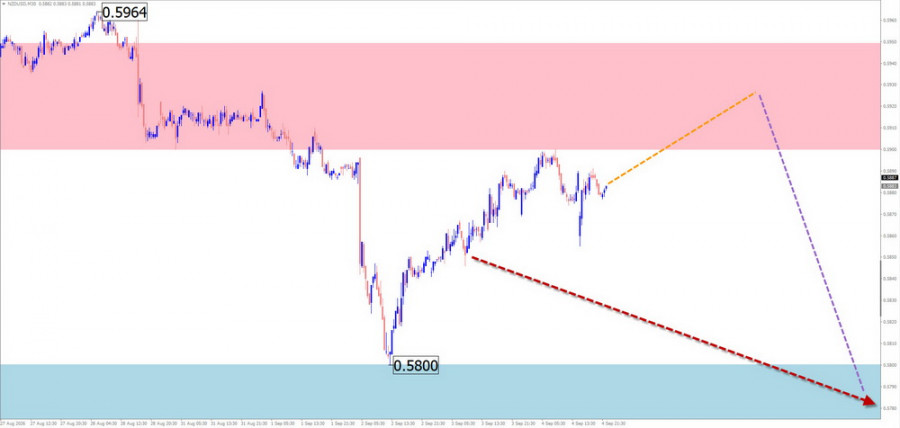
Since June this year, the kiwi has continued to move within an upward flat pattern. On a higher time frame, this segment forms part of a correction, which remains incomplete at the time of analysis. The latest unfinished upward segment with reversal potential began on September 2. The major's price is confined to a narrow range between zones pointing in opposite directions.
Weekly forecast:
In the first few days, the bullish direction is likely to continue, with the price rising toward the resistance boundaries. A change in direction can be expected in the second half of the week. The support zone indicates the lower boundary of the pair's expected weekly range. A resumption of the upward move can be expected as early as next week.
Potential reversal zones
Resistance:
Support:
Recommendations
Buying: There will be no conditions for buying in the coming days.
Selling: May be considered with reduced position sizes after confirmed reversal signals appear near the resistance zone.
GOLD
Brief analysis:
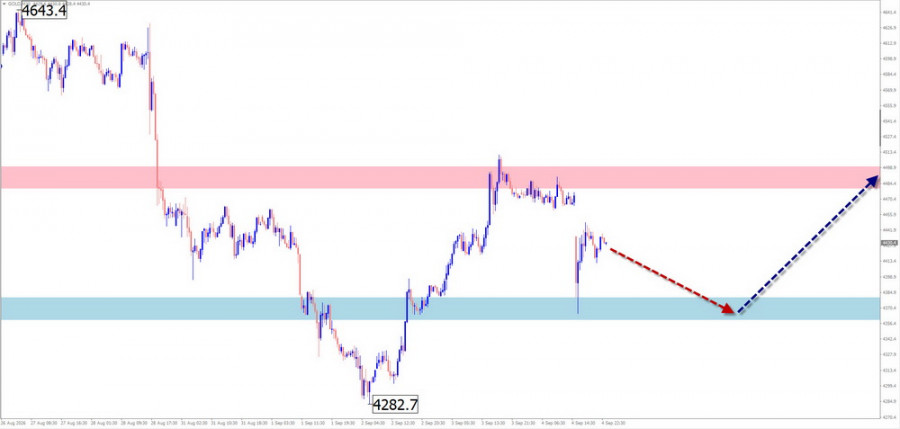
In the short term, gold prices have been forming a flat pattern on the chart since mid-August, with the price moving mainly sideways. This entire segment forms a correction of the preceding uptrend segment. At present, the wave structure most closely resembles a running flat without a final segment.
Weekly forecast:
At the beginning of the week, sideways movement in gold prices is the most likely scenario. A decline toward the support zone levels is possible. Subsequently, conditions for a reversal and resumption of the rise in gold prices may develop. The upper boundary of the expected weekly range is indicated by the calculated resistance zone.
Potential reversal zones
Resistance:
Support:
Recommendations
Selling: Carries a high level of risk; it is safer to use reduced position sizes.
Buying: Will become relevant after confirmed signals from your trading systems appear near the support zone.
Bitcoin
Brief analysis:
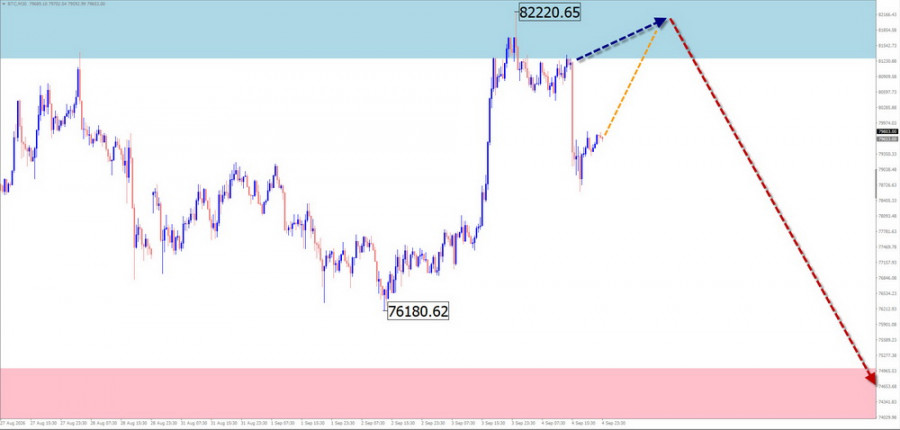
The direction of Bitcoin's short-term trend has been determined by a downward wave since mid-August this year. Over the past week, an unfinished corrective segment of this wave has been forming. The price is approaching the upper boundary of a potential reversal zone on the daily time frame.
Weekly forecast:
In the coming days, the most likely scenario is a continuation of the upward move until the price reaches the boundaries of the resistance zone. A reversal is then highly likely. A decline in the price can be expected at the end of the current week or during the following week.
Potential reversal zones
Resistance:
Support:
Recommendations
Selling: May be used with reduced position sizes during individual trading sessions. The potential is limited by the support zone.
Buying: Will become relevant after corresponding signals from your trading systems appear near the support zone.
Explanations: In simplified wave analysis (SWA), all waves consist of three parts (A-B-C). In each time frame, the latest unfinished wave is analyzed. Expected movements are shown with a dashed line.
Attention: The wave algorithm does not take into account the duration of an instrument's movements over time.




















 আমাদের সাথে যোগাযোগ করুন