The EUR/USD currency pair "came to its senses" on Tuesday. Recall that on Monday, the pair showed high volatility by current standards, but Tuesday demonstrated that it was a one-off. And it's not to say that there were no important events on Tuesday. For example, Donald Trump announced new 25% tariffs for all countries that trade with Iran, and in the US, an inflation report was published that is extremely significant for the Federal Reserve and monetary policy. Yes, the consumer price index showed a rather "bland" value that matched forecasts. But that value suggests that the Fed will not change the key rate in January. And for the dollar, a lack of new easing is positive news.
But what difference does it make whether the news is positive or negative if the market continues to trade with 50-pip daily volatility? And that's the best case. Yesterday, for example, volatility was lower. The downtrend remains in force, as evidenced by the descending trendline, and the market continues to trade in a "convulsions" mode. And inside the sideways channel on the daily TF. Six months in a row.
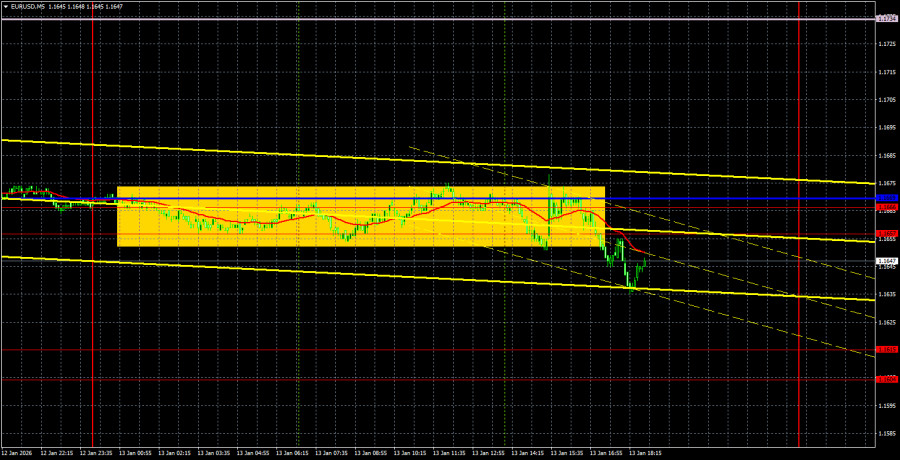
On the 5-minute TF for most of Tuesday, the price moved exclusively sideways in a 25-pip range. Total flat even intraday. Only during the US session did the market "wake up" and close below the 1.1657–1.1669 area, which, however, does not open any prospects for the dollar. Nevertheless, traders could have worked this sell signal and earned about 10–15 pips.
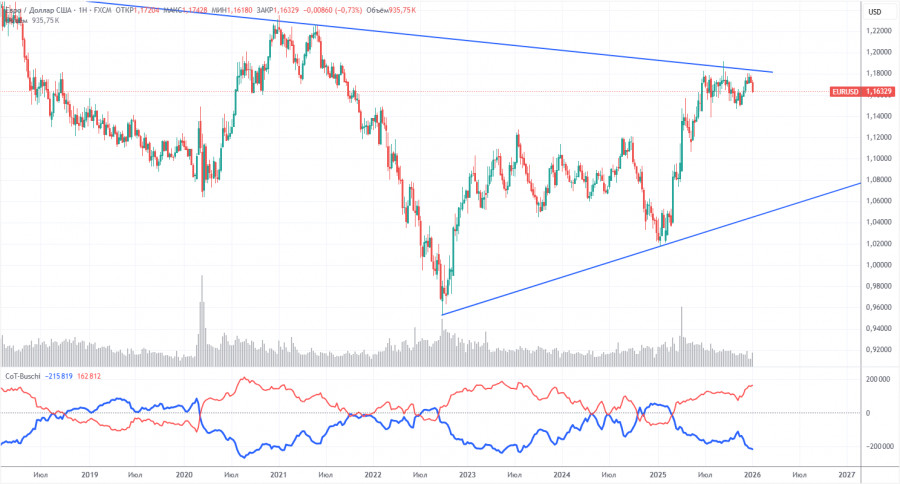
The latest COT report is dated January 6. The illustration above clearly shows that the net position of non-commercial traders was bullish for a long time; bears struggled to gain the upper hand at the end of 2024 but quickly lost it. Since Trump took office for the second time, only the dollar has been falling. We cannot say that the decline of the US currency will continue with 100% probability, but current world events suggest that it will. The red and blue lines are diverging, indicating strong bull dominance.
We still do not see any fundamental factors for the strengthening of the euro, while there remain plenty of factors for the US currency's decline. The global downtrend still persists, but what does it matter where the price moved over the last 17 years? Over the past three years, only the euro has been rising, and that is also a trend.
The placement of the red and blue indicator lines continues to indicate the preservation and strengthening of the bullish trend. During the last reporting week, the number of longs in the "Non-commercial" group increased by 3,500, while shorts decreased by 1,800. Accordingly, the net position rose by another 5,300 contracts over the week.
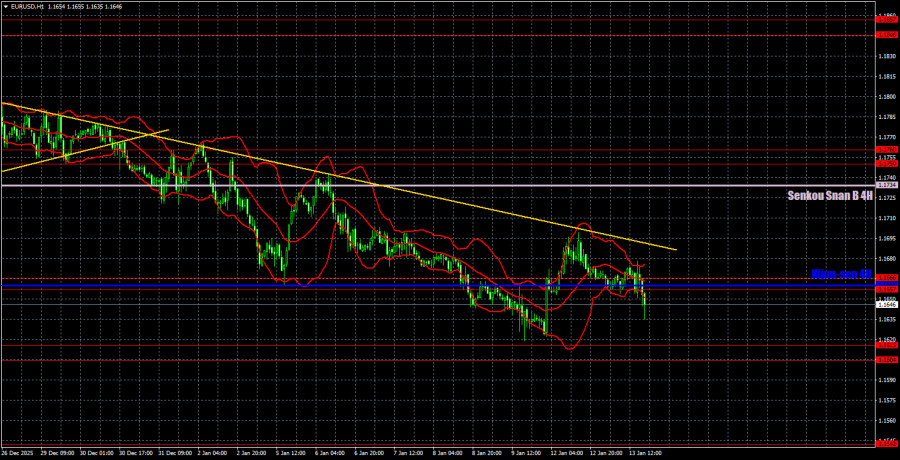
On the hourly timeframe, the EUR/USD pair continues forming a downtrend. Several weeks ago, the upper line of the sideways channel 1.1400–1.1830 was tested twice, but the euro failed to break out of it. Thus, technically, the pair's decline is logical. To count on euro growth and a new attempt to overcome the 1.1800–1.1830 area, one should at least wait for a break above the trendline.
For January 14, we highlight the following levels for trading: 1.1234, 1.1274, 1.1362, 1.1426, 1.1542, 1.1604–1.1615, 1.1657–1.1666, 1.1750–1.1760, 1.1846–1.1857, 1.1922, 1.1971–1.1988, and also the Senkou Span B (1.1734) and Kijun-sen (1.1660) lines. Ichimoku indicator lines may shift during the day, which should be taken into account when determining trading signals. Don't forget to move a Stop Loss to breakeven if the price moves 15 pips in the favorable direction. This will protect against possible losses if the signal proves false.
On Wednesday, no significant events are scheduled in the EU, while several less significant US reports will be released, such as PPI and retail sales. But what reaction should one expect to PPI if yesterday the reaction to the CPI report was only about 25 pips?
On Wednesday, traders can trade from the 1.1657–1.1666 area and the Kijun-sen line. A close below this area would already have allowed opening short positions on Tuesday, targeting 1.1604–1.1615. Given current volatility, trades can be held open for several days. We would recommend considering long positions only after a break above the trendline.

RYCHLÉ ODKAZY


 Kontaktujte nás

