The GBP/USD currency pair was unable to show any significant rise or fall throughout Friday. The day before, on news of failed negotiations between Iran and the US, the British currency plummeted, effectively making it the biggest loser in the currency market. That same day, the European currency hardly changed in value. Thus, the British pound has been the most affected by geopolitics lately. Regarding local macroeconomic data, there were no reports published in the UK on Friday, while in the US, the Producer Price Index (PPI) was released. This index influences the Consumer Price Index (CPI), but I want to remind you that the last inflation report, which showed a decline to 2.4%, generated virtually no reaction. The PPI did not elicit a response either, despite its fairly high core value, which warns of a possible acceleration of core inflation.
Overall, the pound had reasons for a decline in February. This includes geopolitics, market expectations that the Bank of England will ease policy, and a series of negative reports from the UK. However, it is worth noting that reports in the US have also been quite mediocre. For example, in the fourth quarter, the economy slowed to 1.4%, and the NonFarm Payrolls for 2025 were revised to a minimal value. On Saturday, a war between the US and Iran began, involving Israel, Kuwait, Bahrain, and even the UAE. Therefore, one should not be surprised by a new rise in the dollar on Monday. However, this is not guaranteed.
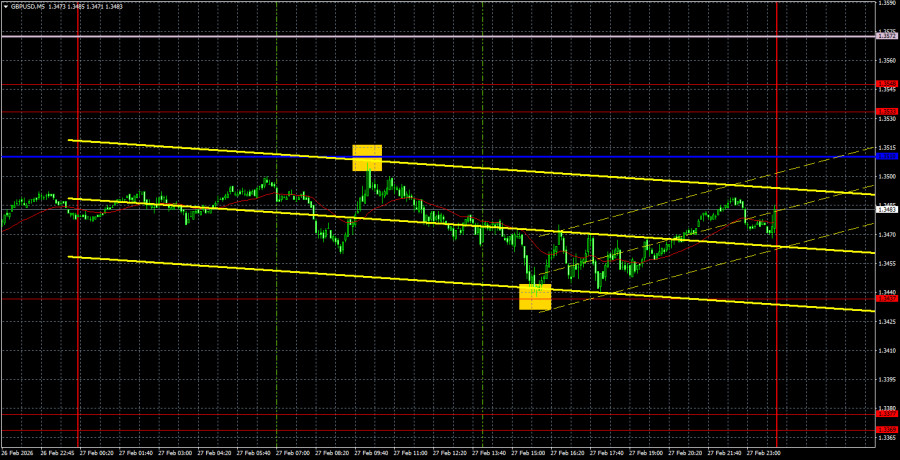
On the 5-minute timeframe, two trading signals formed on Friday. Both had minimal errors. Initially, the price bounced off the critical Kijun-sen line, and then from the level of 1.3437. In both cases, the pair moved in the desired direction, enabling traders to profit.
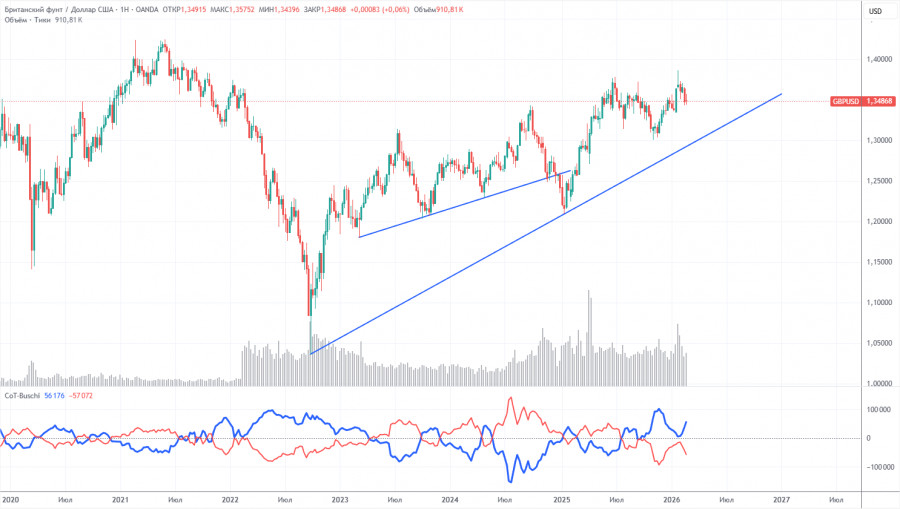
The COT reports for the British pound show that the sentiment of commercial traders has been changing frequently in recent years. The red and blue lines representing the net positions of commercial and non-commercial traders constantly intersect and are often close to the zero mark. Currently, the lines are approaching each other, with non-commercial traders still dominating with... sales. Recently, speculators have actively increased their long positions but have not yet moved into a zone of superiority.
The dollar continues to decline due to Donald Trump's policies, which are clearly visible on the weekly timeframe (illustration above). The trade war will continue in one form or another for a long time, and the Fed will, in any case, lower rates in the next 12 months. Demand for the dollar will fall in any case. According to the last COT report (dated February 24) for the British pound, the "Non-commercial" group closed 14,800 BUY contracts and 100 SELL contracts. Thus, the net position of non-commercial traders decreased by another 14,700 contracts over the week.
In 2025, the pound rose quite significantly, but it should be understood that this was solely due to Trump's policies. Once this reason is mitigated, the dollar could start rising. But when that will happen is anyone's guess.
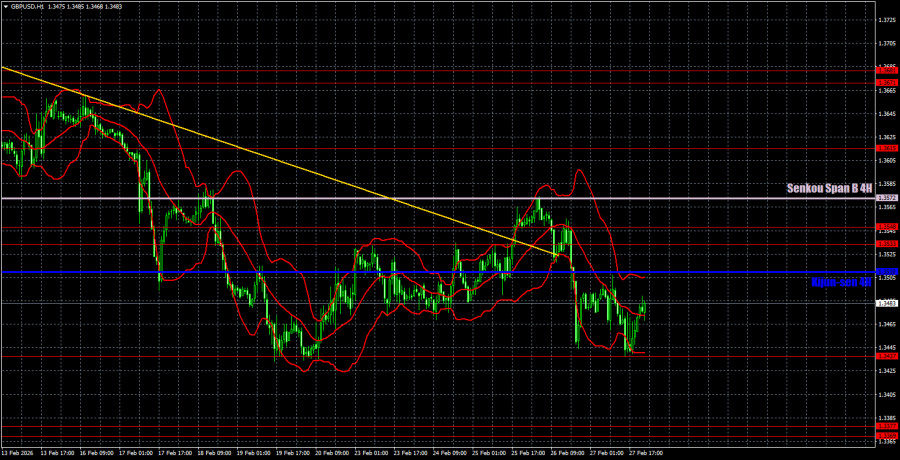
On the hourly timeframe, the GBP/USD pair may be poised to form an upward trend, but at the moment it is much closer to another decline. The level of 1.3437 is the last hope for the British currency's salvation. The military conflict in the Middle East does not add optimism for bulls, but the pound sterling cannot fall forever, and there are important data in the US this week.
For March 2, we highlight the following important levels: 1.3201-1.3212, 1.3307, 1.3369-1.3377, 1.3437, 1.3533-1.3548, 1.3615, 1.3671-1.3681, 1.3751-1.3763, 1.3846-1.3886, 1.3948. The Senkou Span B (1.3572) and Kijun-sen (1.3510) lines may also serve as sources of signals. It is recommended to set the stop-loss order to breakeven if the price moves 20 pips in the correct direction. The lines of the Ichimoku indicator may shift throughout the day, which should be considered when determining trading signals.
On Monday, the UK is scheduled to publish the second estimate of business activity in the manufacturing sector for February. In the US, the much more important ISM index for the manufacturing sector will be released. Plus, we should not forget the conflict in the Middle East, which may also affect the dollar's exchange rate.
On Monday, traders can open long positions targeting the Senkou Span B line if the pair surpasses the critical line or bounces again from the level of 1.3437. Short positions will become relevant targeting 1.3437 if the price bounces off the Kijun-sen line or the area of 1.3533-1.3548.
Price support and resistance levels are indicated by thick red lines where the movement may end. They do not serve as sources of trading signals.
The Kijun-sen and Senkou Span B lines are Ichimoku indicator lines that are transferred from the 4-hour timeframe to the hourly timeframe. They are strong lines.
Extreme levels are indicated by thin red lines from which the price has previously bounced. They are sources of trading signals.
Yellow lines indicate trend lines, trend channels, and other technical patterns.
Indicator 1 on the COT charts shows the size of the net position of each category of traders.

RYCHLÉ ODKAZY


 Kontaktujte nás

